Pages
The rail on the left lists the pages; on a phone, the bar at the bottom does, with the less used pages under More. The pages update by themselves. A cluster page refreshes its state while it is open, and the Overview and the lists update when Docker reports a change.
Overview
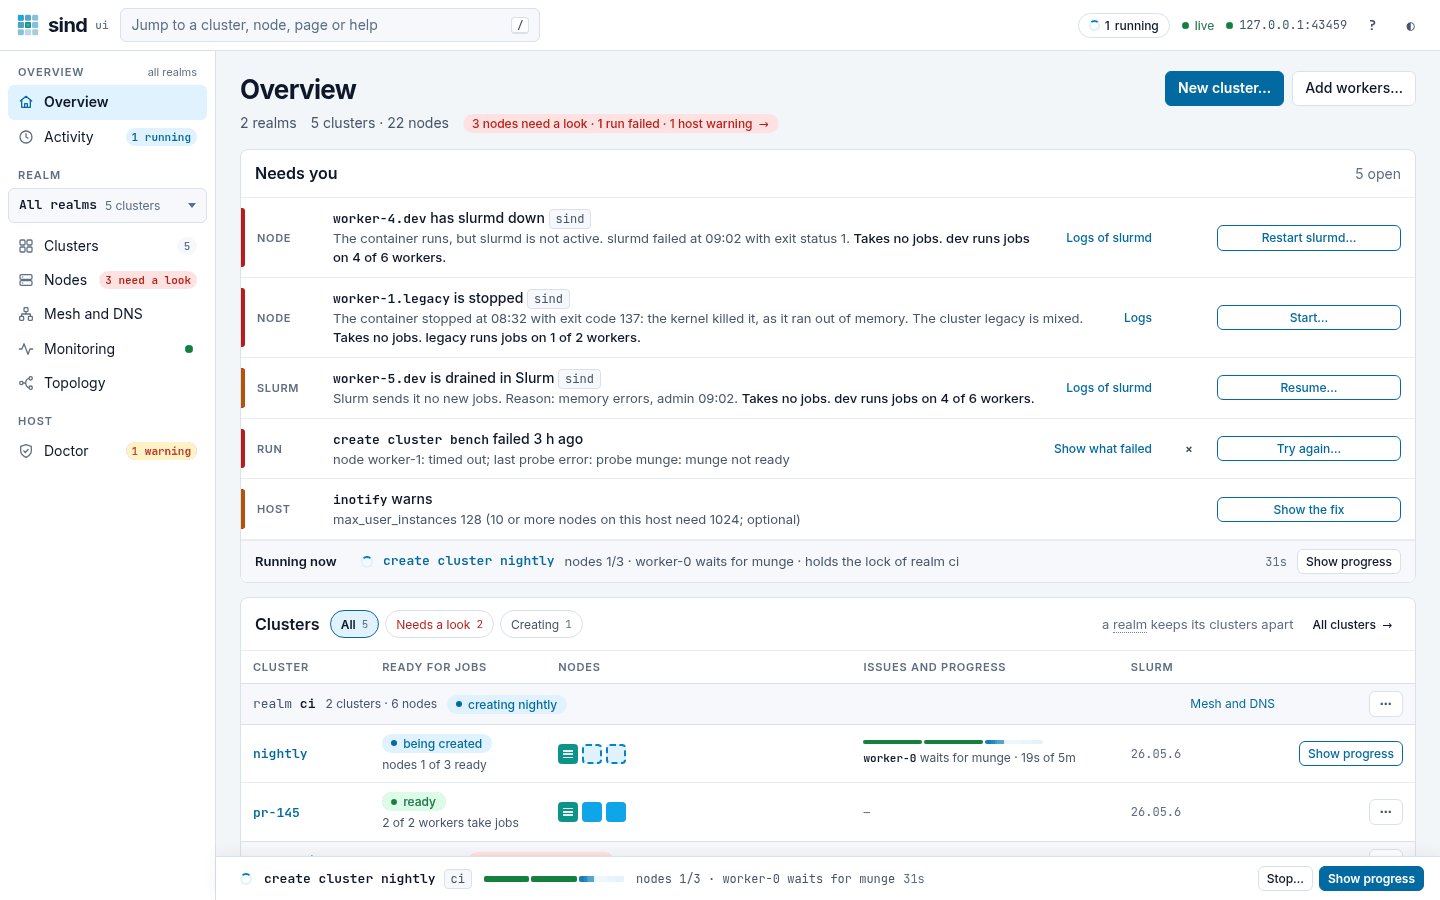
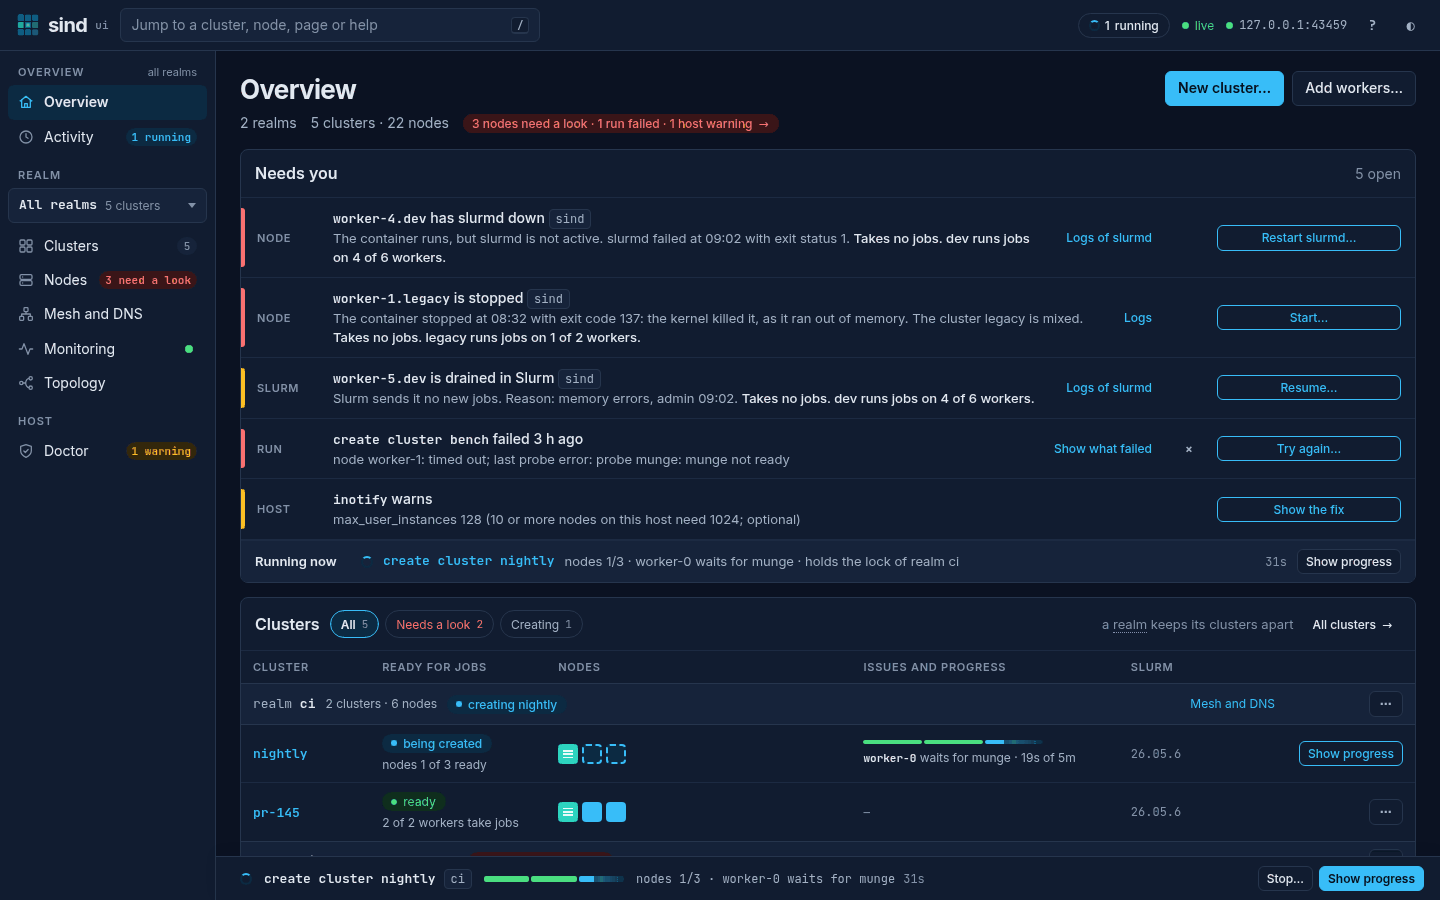
The things that need you come first, with the commands that run now at their end, then a table of every cluster by realm and the recent activity.
Needs you has a row for each problem. A row says what kind of thing it is about, such as Node, Slurm, Run or Host, what is wrong, and what that means for the jobs, such as Takes no jobs. dev runs jobs on 3 of 4 workers. The button on the right most likely fixes it, such as Restart slurmd…, Start…, Resume… or Try again…; the links beside it, such as Logs of slurmd, help you find out why. A failed run stays for 6 hours, until a newer run of the same command in its realm ends ok, or until you dismiss it with the × before its button. When a newer run fixes it, or when a command of sind ui brings back a node that needed a look, such as a restart of its service, the row turns green and says Fixed for 30 seconds. The head of the panel counts the open rows, such as 4 open · 1 fixed. A command that runs is no problem: it shows in the Running now strip at the end of the panel, with its step, how long it runs and Show progress; on a phone the strip is one line for each command. A realm lock row names the commands that wait for it, and a command that waits does not hold the lock.
The head names the problems, such as 2 nodes need a look · 1 run failed, and links to Needs you. A node needs a look when its container does not run, when a service on it is down, or when Slurm sends the worker no jobs, such as a drained one. The Overview, its realm rows, the lists, the cluster pills and the rail count by this one rule, with the same words: the rail says 2 need a look, and a cluster with such nodes says running · 2 need a look, or stopped · 1 needs a look. The count is red when a node does not run or a service is down, and amber when only Slurm sends a worker no jobs. The Overview shows every realm, and with more than one, the label of its rail group says all realms. A node’s own page says what is wrong in its pill, such as running · takes no jobs for a worker whose slurmd is down, running · drained, or running · slurmctld down. sind ui knows that a service is down, and what Slurm says, once it has probed the cluster: every 30 seconds while any page is open, and every 10 seconds while a page of the cluster is open. A service that is down, or a worker that Slurm sends no jobs, does not count while a command works on its cluster, such as one that adds workers or reboots the node: the command may be starting it.
A cluster or node that a command creates or deletes needs no look: it is not up yet, or no longer. It shows what the command does instead. The cluster’s pill says creating · nodes 1/3, deleting · 8 of 11 left, or create queued while the command waits for the realm lock. A node’s pill says ready, starting, queued or deleting, and its tile is dashed until it is ready. Its services say starting or stopping rather than down, and its Slurm state waits until the command ends. The realm row says creating nightly, and the row of the cluster says being created with how far the create got.
Clusters is one table, grouped by realm. A realm’s row says what it holds, such as 2 clusters · 6 nodes, and how it is, such as 3 nodes need a look; select its name to show only that realm on the Overview. It links to Mesh and DNS, says mesh needs a look when sind ui cannot read the mesh, and has a ⋯ menu with Connect a container… and, apart, Delete realm…. Each cluster’s row says whether it is ready for jobs and why: ready with 2 of 2 workers take jobs, needs a look with 4 of 6 workers take jobs (red when a node does not run or a service is down, amber when only Slurm sends a worker no jobs, as the count of the realm), not ready when its controller does not answer or no worker takes jobs, or a command runs while a command works on it. When no node is to blame, the row names the check that fails, such as The data volume is missing, and says what is wrong. Then come its nodes as tiles, with the legend below the table, what is wrong in words, such as worker-5 drained: memory errors, its Slurm version and its ⋯ menu, as on the Clusters page. While a command creates the cluster, its row says being created and nodes 1 of 3 ready, with the bar of the command, the node it works on, such as worker-0 waits for munge · 19s of 5m, and Show progress. The chips Needs a look, and Creating or Deleting while a command does that, keep those clusters: Needs a look keeps each cluster whose pill says needs a look or not ready. An empty realm says so and offers New cluster…. In a narrow window the Slurm column goes, and on a phone each cluster is a card under its realm.
Clusters
Every cluster of the realm. sind keeps no list of clusters. It finds them by their Docker labels.
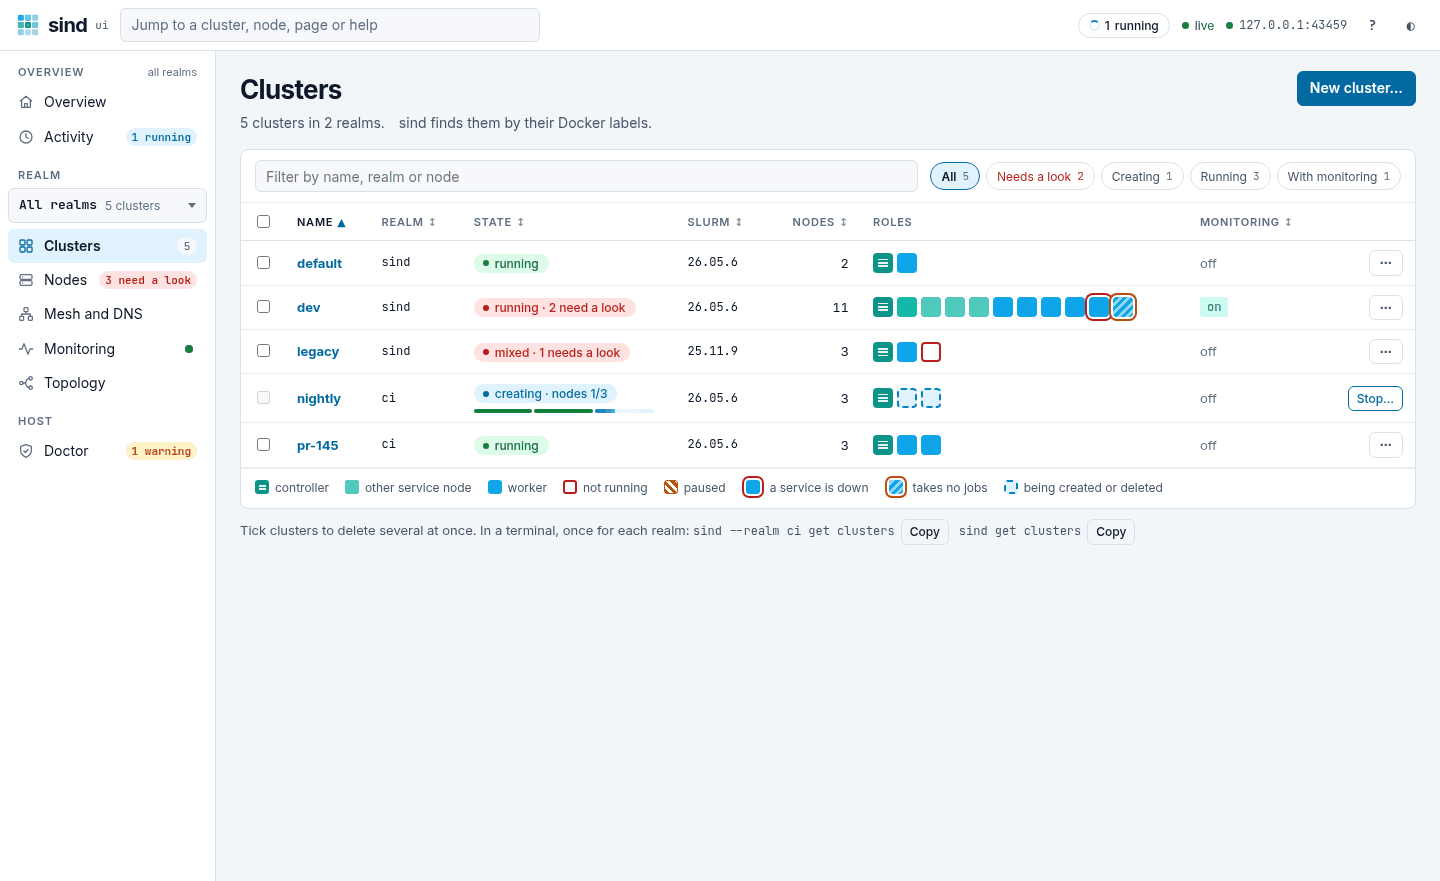
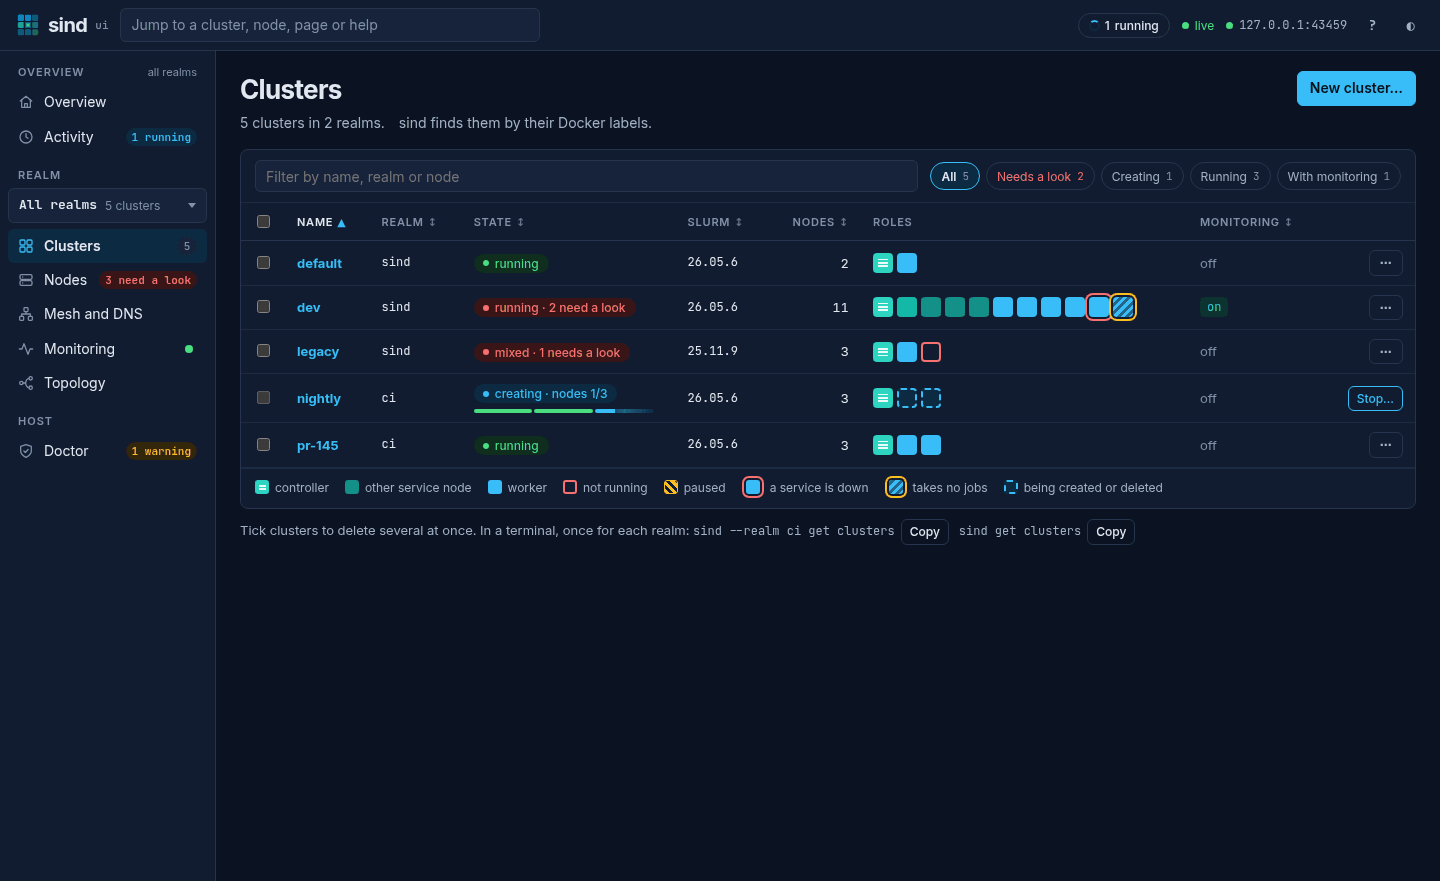
Type in Filter to show only the clusters whose name, realm, state or nodes hold every word you type. Esc clears it. The chips above the table show the clusters that need a look, those that run, or those with monitoring, each with its count. While a command creates or deletes a cluster, a Creating or Deleting chip shows it, and Running leaves it out. Such a cluster has a thin progress bar under its pill and, in place of its ⋯ menu, Stop… while sind ui creates it, or else Show progress. You cannot select it. The ⋯ menu of a row has Add workers…, Power…, Logs, which opens the Logs tab of the cluster, and Copy shell command, which copies sind enter for the cluster and says so, and apart, under Can lose data, Delete cluster…, which says when files on a data volume go too. The legend below the table says what the tiles mean. Select a column head to sort by it, and again to reverse the order. Sort by state puts the clusters that need a look first. The address keeps the filter, the chip and the order, so a link or a reload shows the same list.
Tick clusters to delete several at once. Delete 2 clusters… in the bar (it counts them) opens one dialog with a row for each: what goes and what stays of it. You type their number to confirm. sind ui runs one sind delete cluster for each.
New cluster
New cluster… opens the page that makes a cluster: a start, the name and realm, the nodes, where your files go and more options, with the plan of what sind runs beside them. Actions describes it.
Nodes
Every node of the realm. A node is named as you type it in commands, such as worker-0.dev.
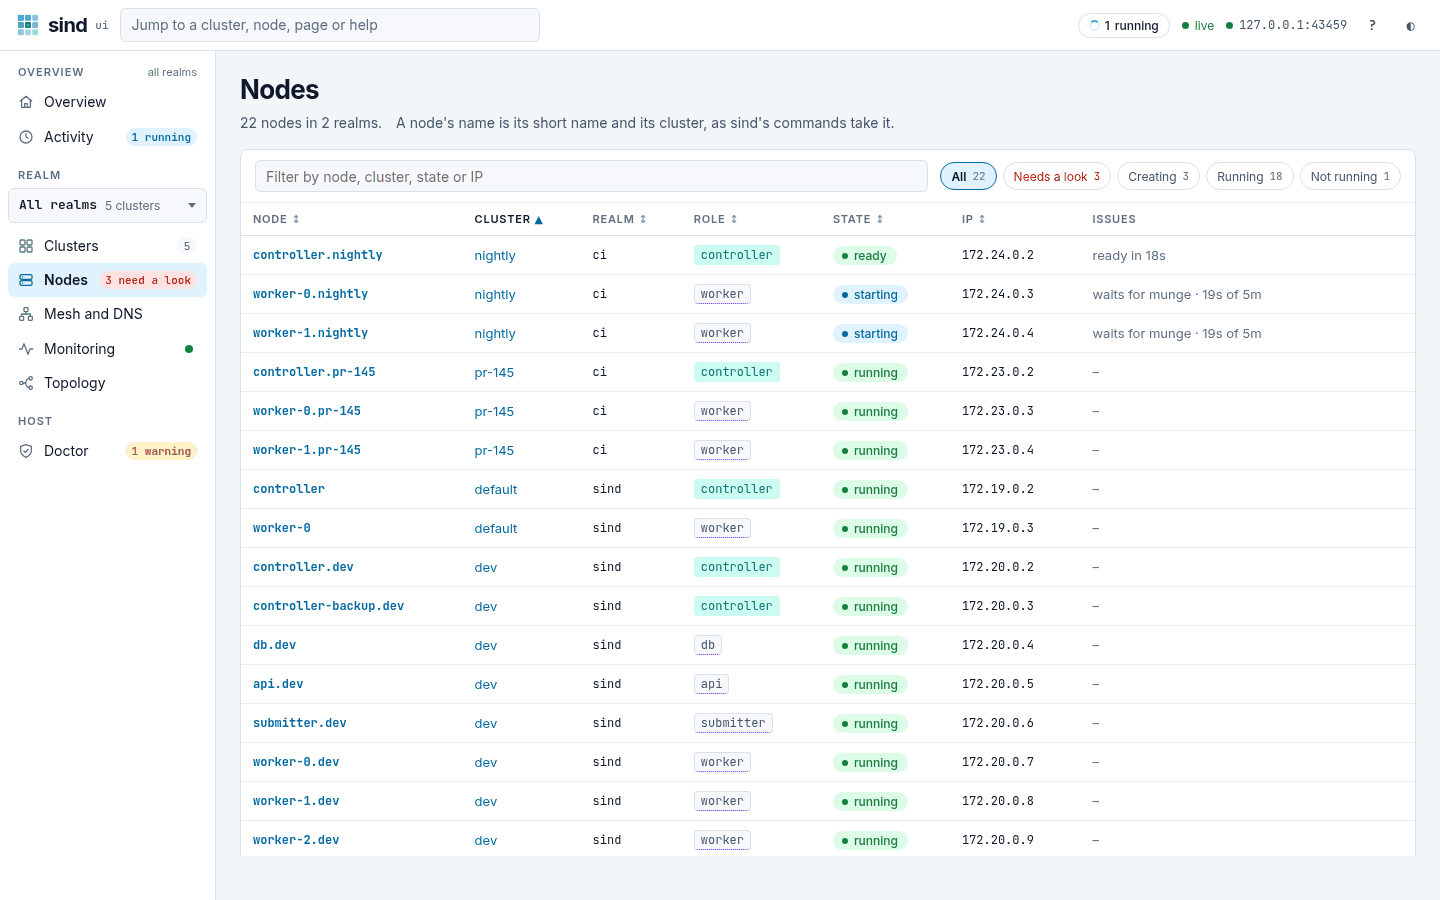
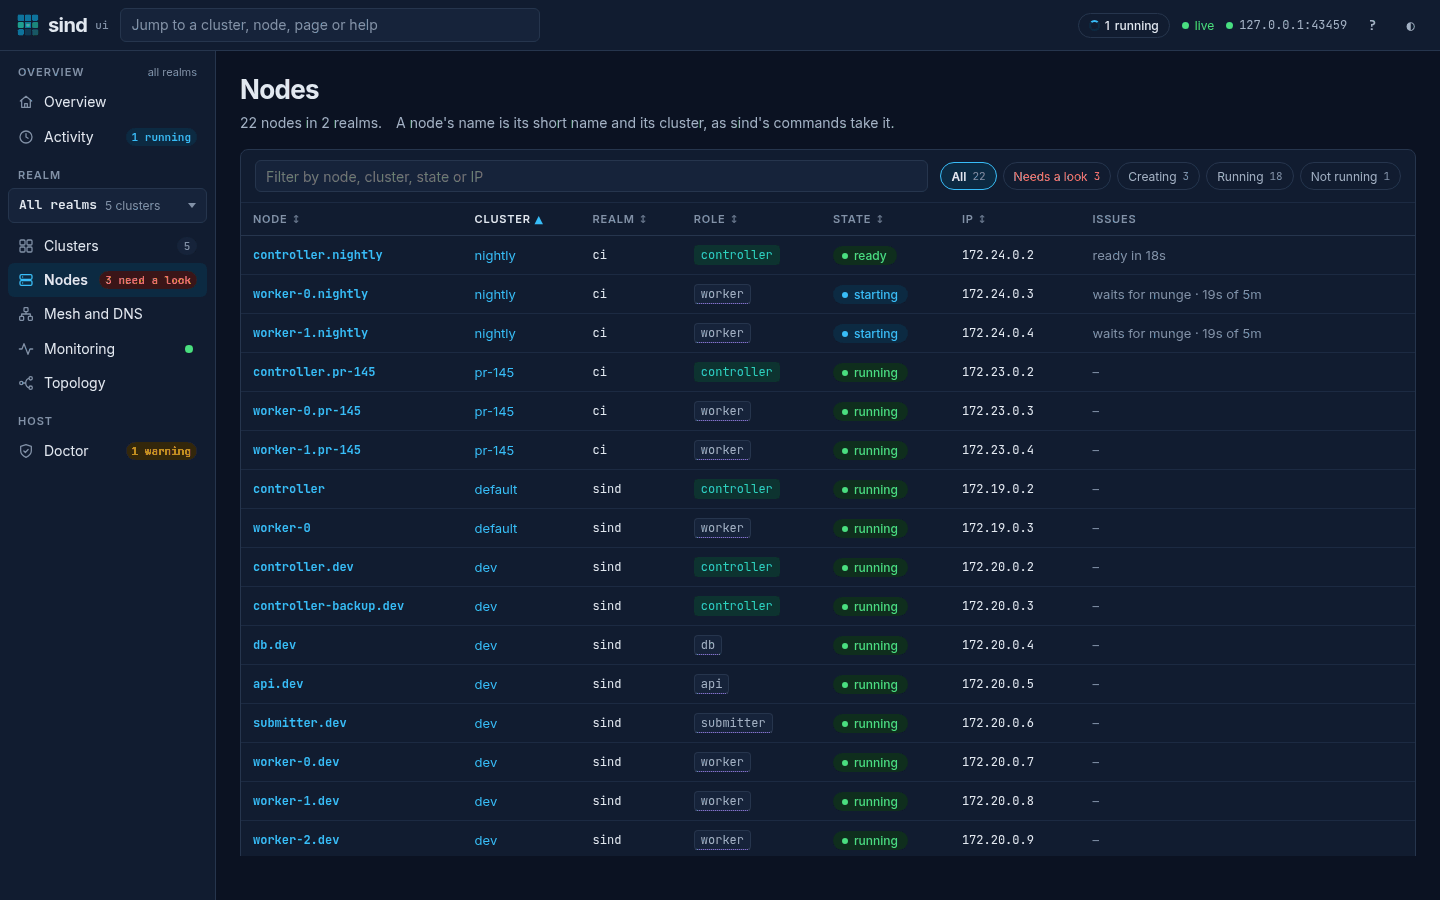
Filter, the chips (Needs a look, Running, Not running, and Creating or Deleting while a command does that) and the column heads work as on the Clusters page. The Issues column adds the reason that Slurm gives for a drained worker. Sort by state puts the nodes that are stopped, or that have a service down, first.
On a phone, each row of a list is a card with the name and the state first.
Cluster
The state of one cluster, in six tabs.
Summary starts with Ready for jobs: it says whether the cluster can run a job now, and checks the controller, the workers, accounting and where your files are. A check that fails names the node and links to its logs. While sind create cluster makes the cluster, a panel at the top shows its steps and where each node stands, such as waits for munge · 19s of 5m, with Show progress, and Stop the create… when sind ui started the create. Add workers… and Delete cluster… are off until the create ends. Ready for jobs says not yet, each check waits, and the first commands show once the create ends ok. Beside the checks are the first two commands of a job, sind enter and sbatch, with Copy. A check of the workers lists each worker that takes no jobs in a row of its own, with its issue, why in a few words (since 09:41, exit code 137, out of memory, or the reason of Slurm), its logs and its first fix, such as Restart slurmd… or Resume…. A drained worker whose services run has no logs there: its journal does not say why someone drained it, the reason does. It shows six rows, and says how many more there are. Below are the nodes as tiles, with a legend of what each tile means (a red ring for a service down, an amber ring and stripes for a worker that takes no jobs), a matrix of nodes and services, such as munge, sshd and slurmctld, with a Slurm column for the state of each worker, and the network checks. Each tile and each cell of the matrix has its state in words for screen readers and as a tooltip, such as worker-4.dev, running, slurmd down. The Nodes tab keeps the number of nodes and adds how many need a look, such as 2 need a look.
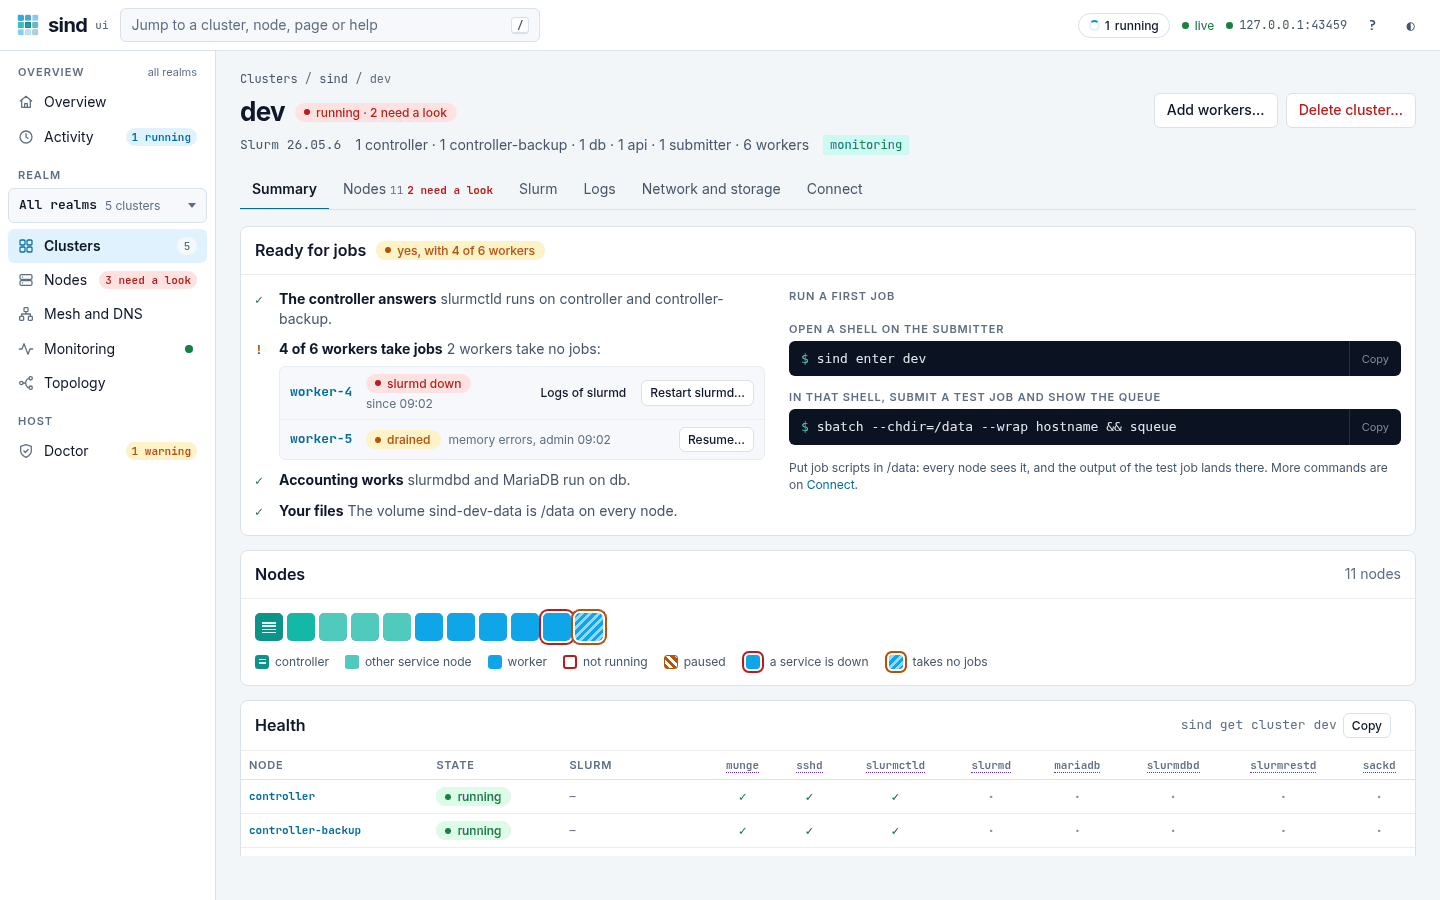
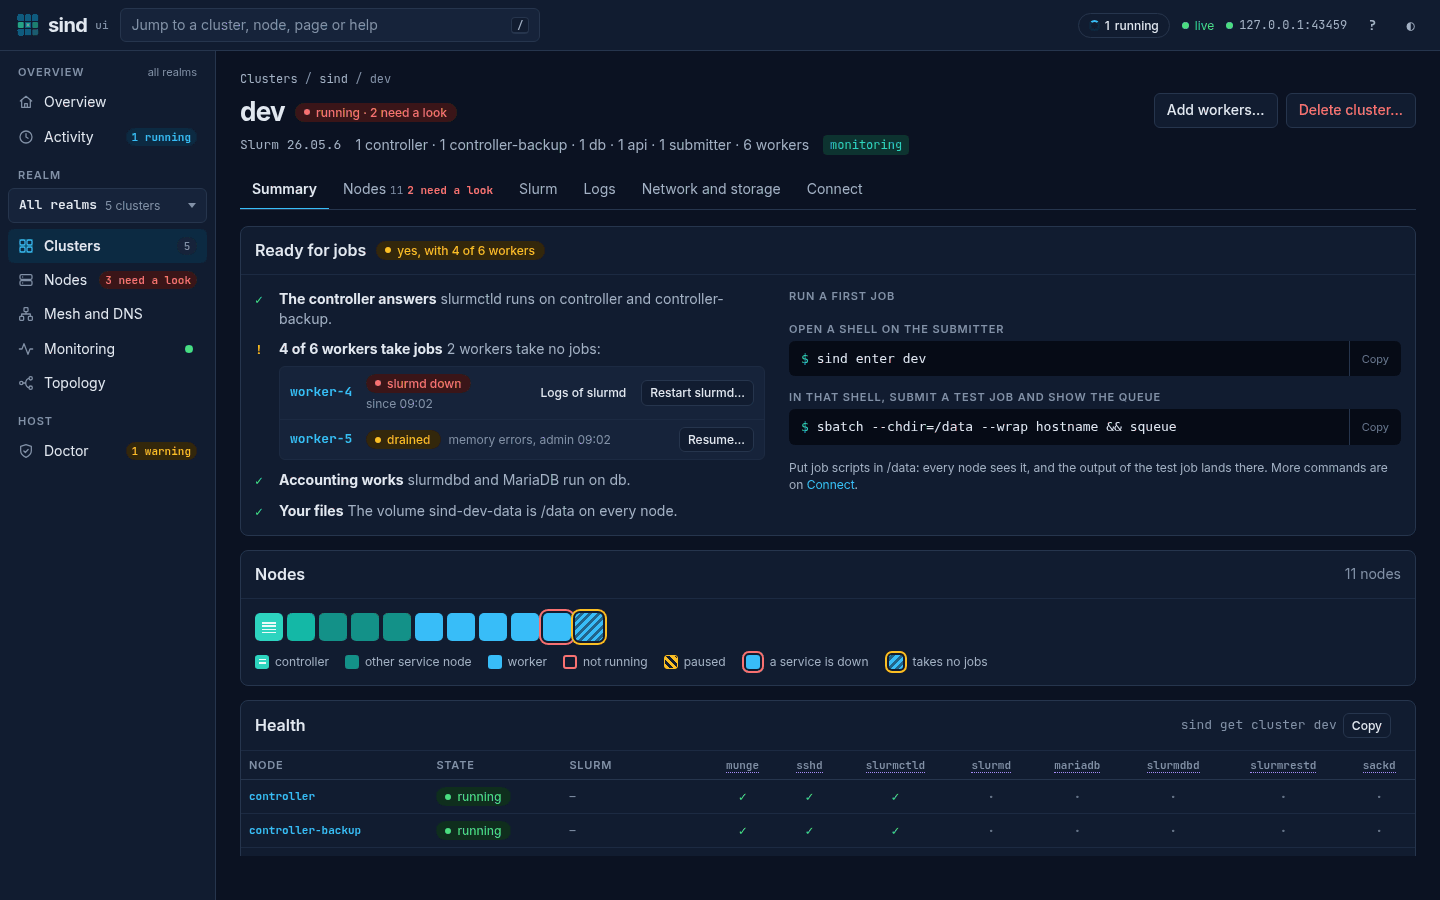
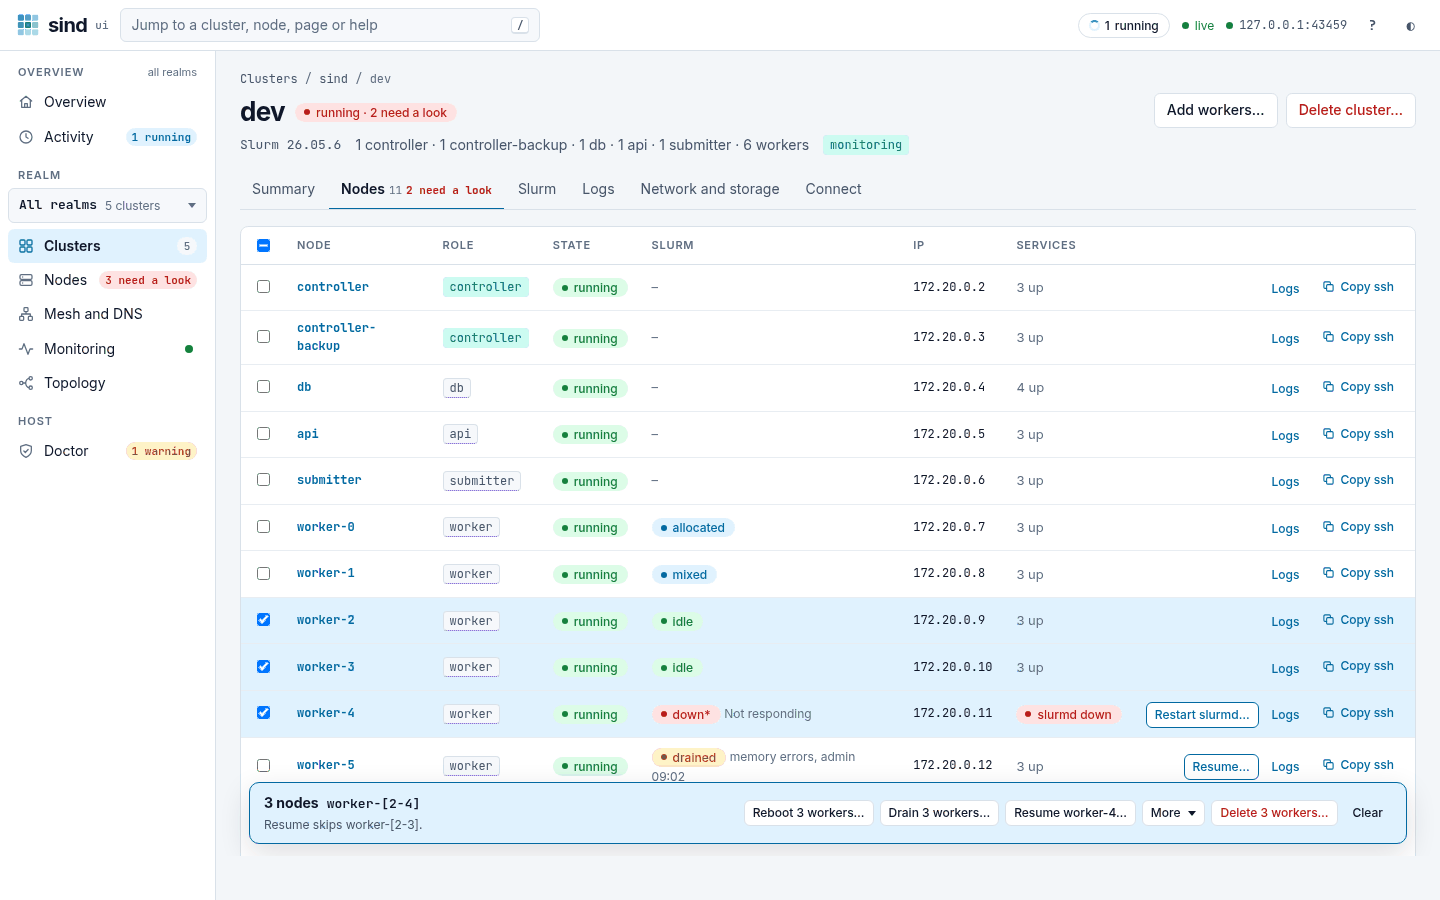
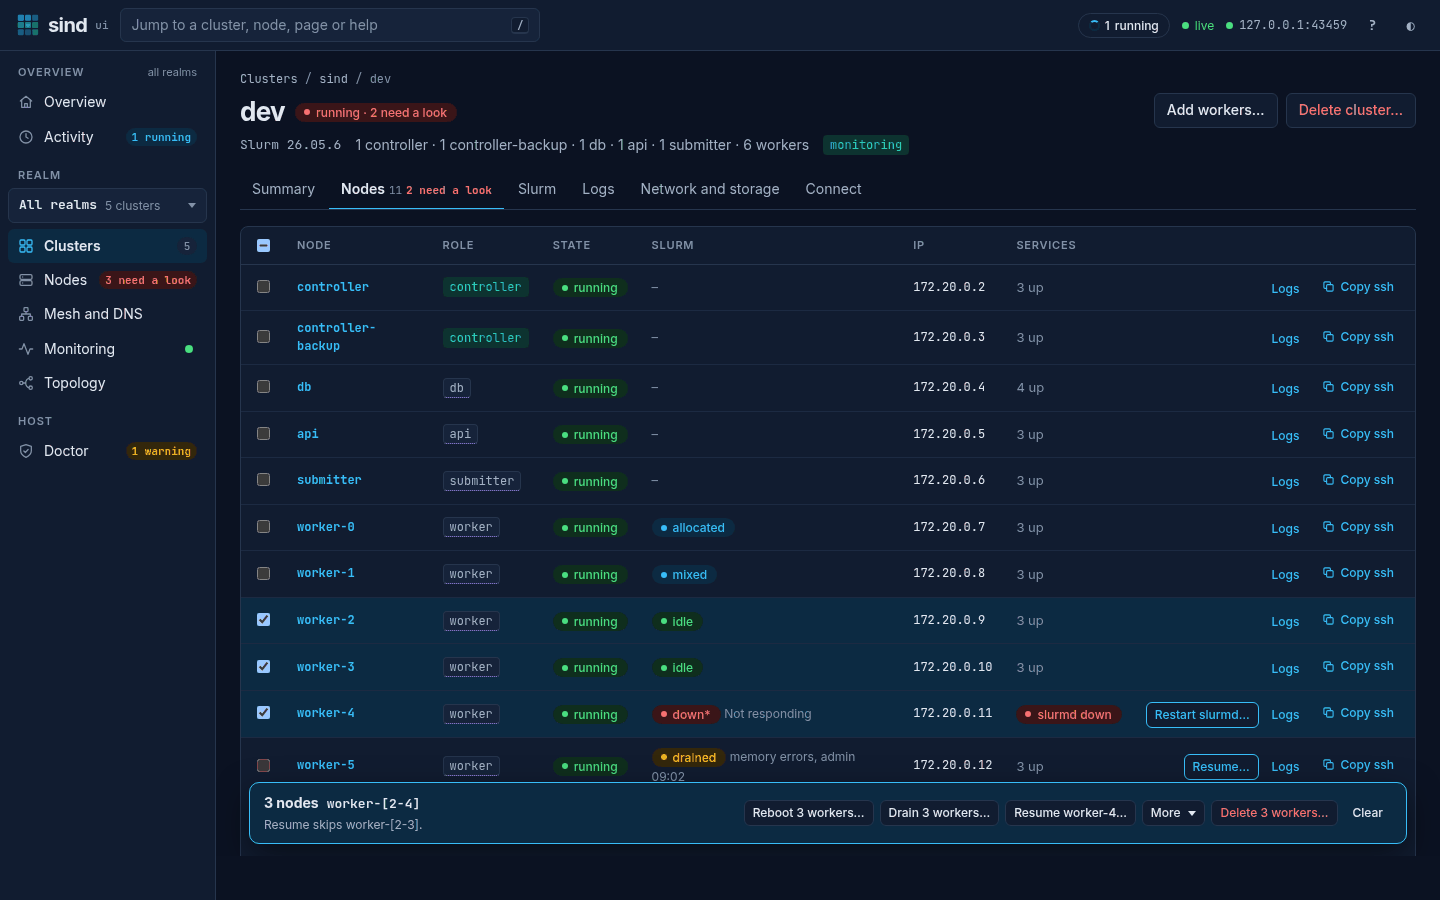
Nodes lets you select nodes. A bar at the bottom of the page shows how many and their node set, such as 3 nodes worker-[2-4], and offers only the actions that fit them: Start… for nodes that do not run, Reboot… for nodes that run, Drain… and Resume… for workers that Slurm lists, and delete for workers; Shut down…, Freeze… and Unfreeze… are under More. Each button names the nodes it acts on, such as Reboot worker-5…, Drain 3 workers… or Delete 3 workers…, and when an action fits only some of the nodes, a line names those it skips, such as Drain and Delete skip controller. The table is one stop of Tab: the arrow keys move between the rows and the buttons of a row, Space ticks a node, and a moves to the bar. A node that needs a look has its first fix in its row, such as Restart slurmd…, Start… or Unfreeze…, except while a command creates or deletes the node. Each row has Logs, which opens the Logs tab of the node’s page, and Copy ssh, which copies the command that logs in to the node and says so. The Slurm column shows the state that sinfo reports for each worker, such as idle, allocated or drained, and the reason.
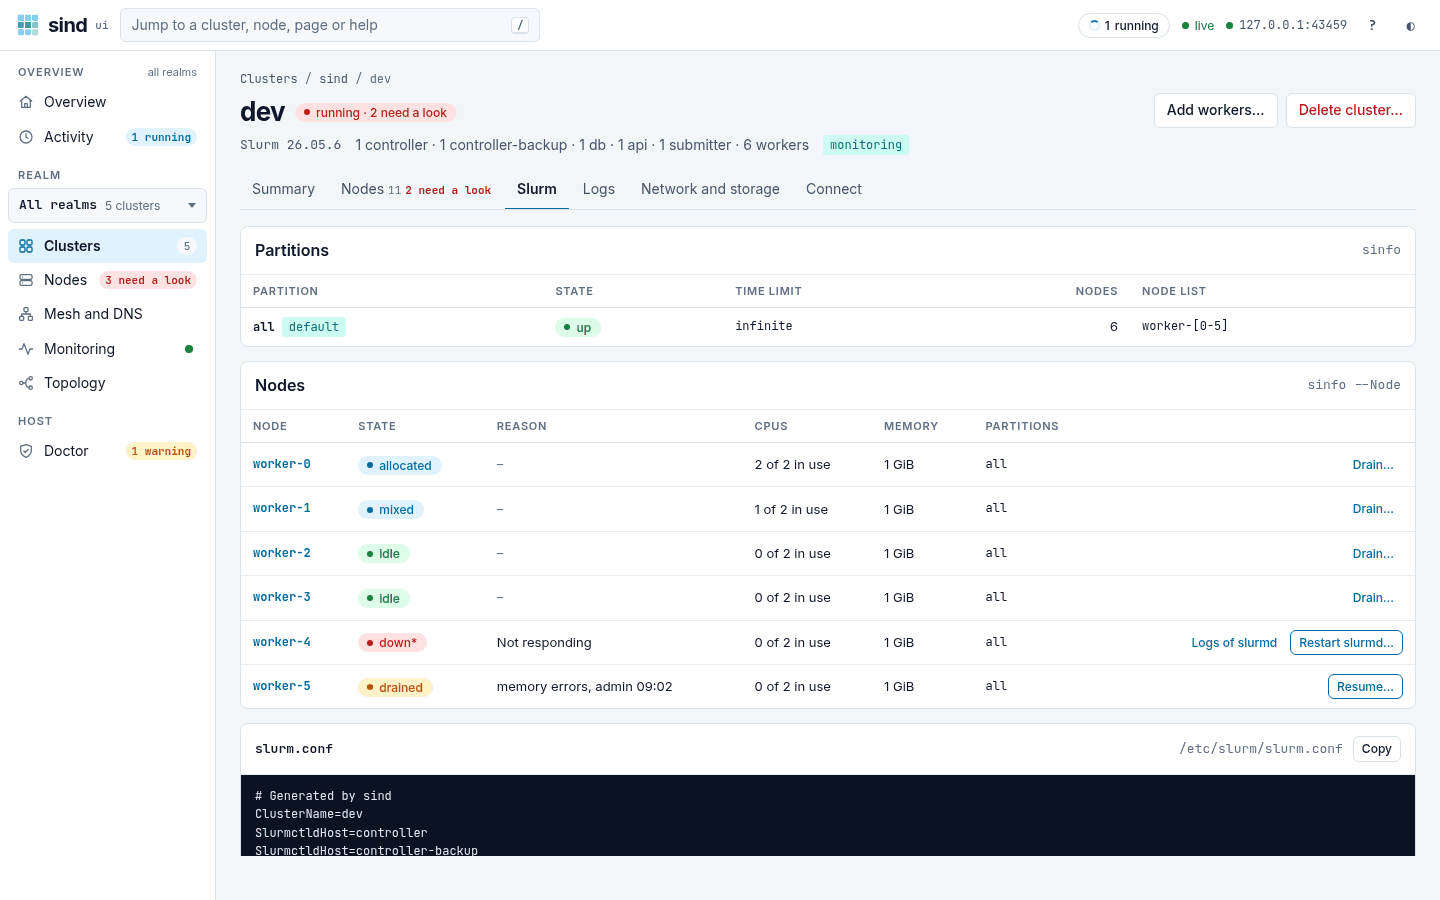
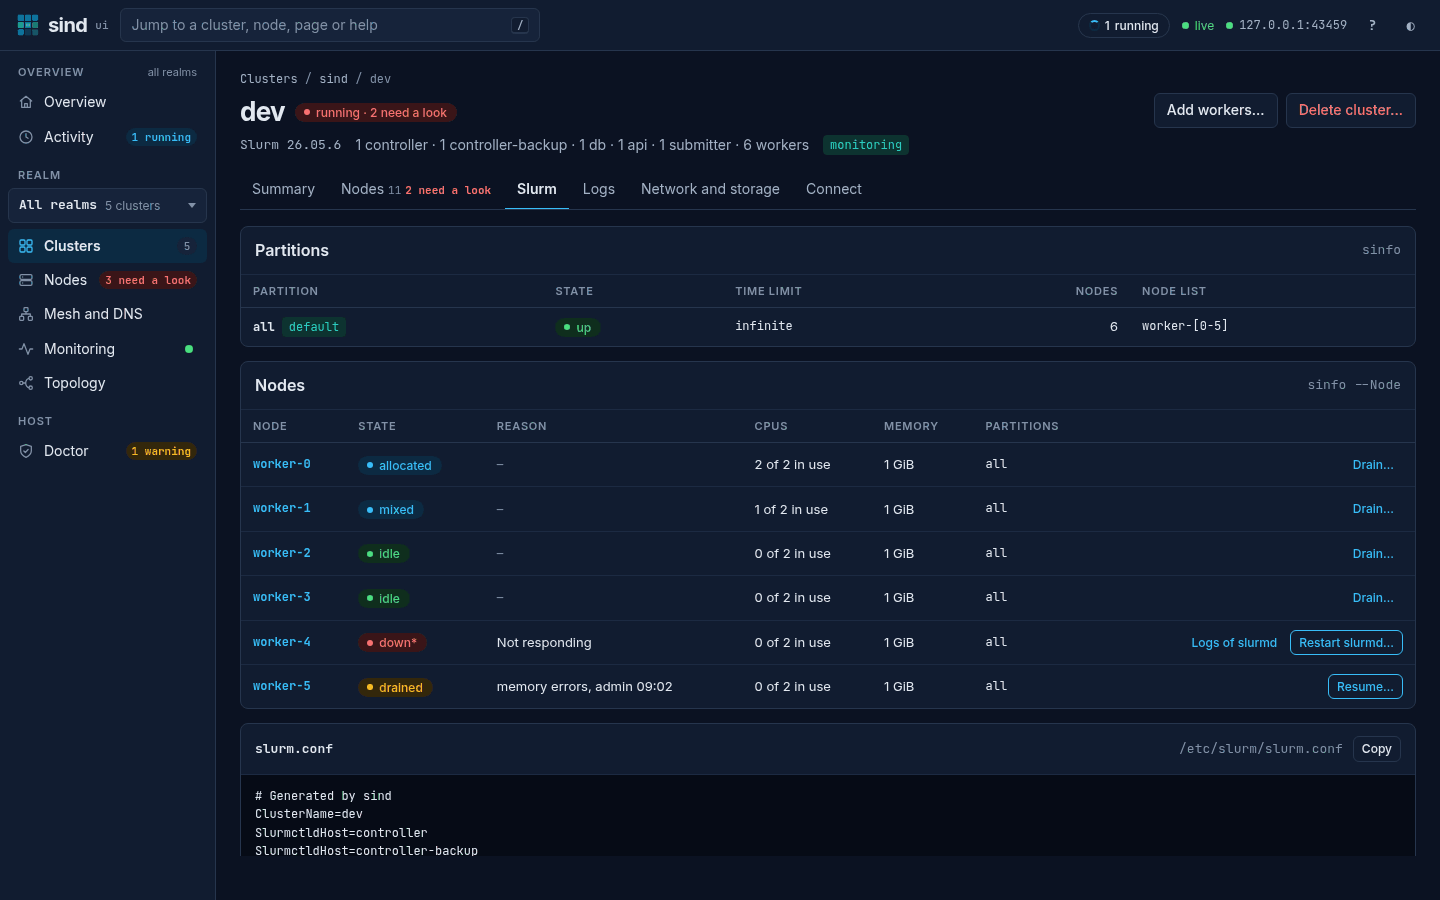
Slurm shows what Slurm says: the partitions, the state, reason, CPUs and memory of each worker, and the slurm.conf and sind-nodes.conf that sind wrote, each with Copy. View slurm.conf on the Summary leads here. sind ui runs sinfo on the controller each time it reads the status of the cluster, and gives it 10 seconds. When slurmctld does not answer, the tab says why and still shows the files, which the controller reads without slurmctld. A worker that a command creates or deletes shows the command’s state in place of its Slurm state and reason, such as starting and waits for munge · 19s of 5m. A worker that takes no jobs has its first fix in its row, such as Resume…, after its logs unless Slurm drained it; one that takes jobs has Drain…. On a phone each partition and each worker is a card.
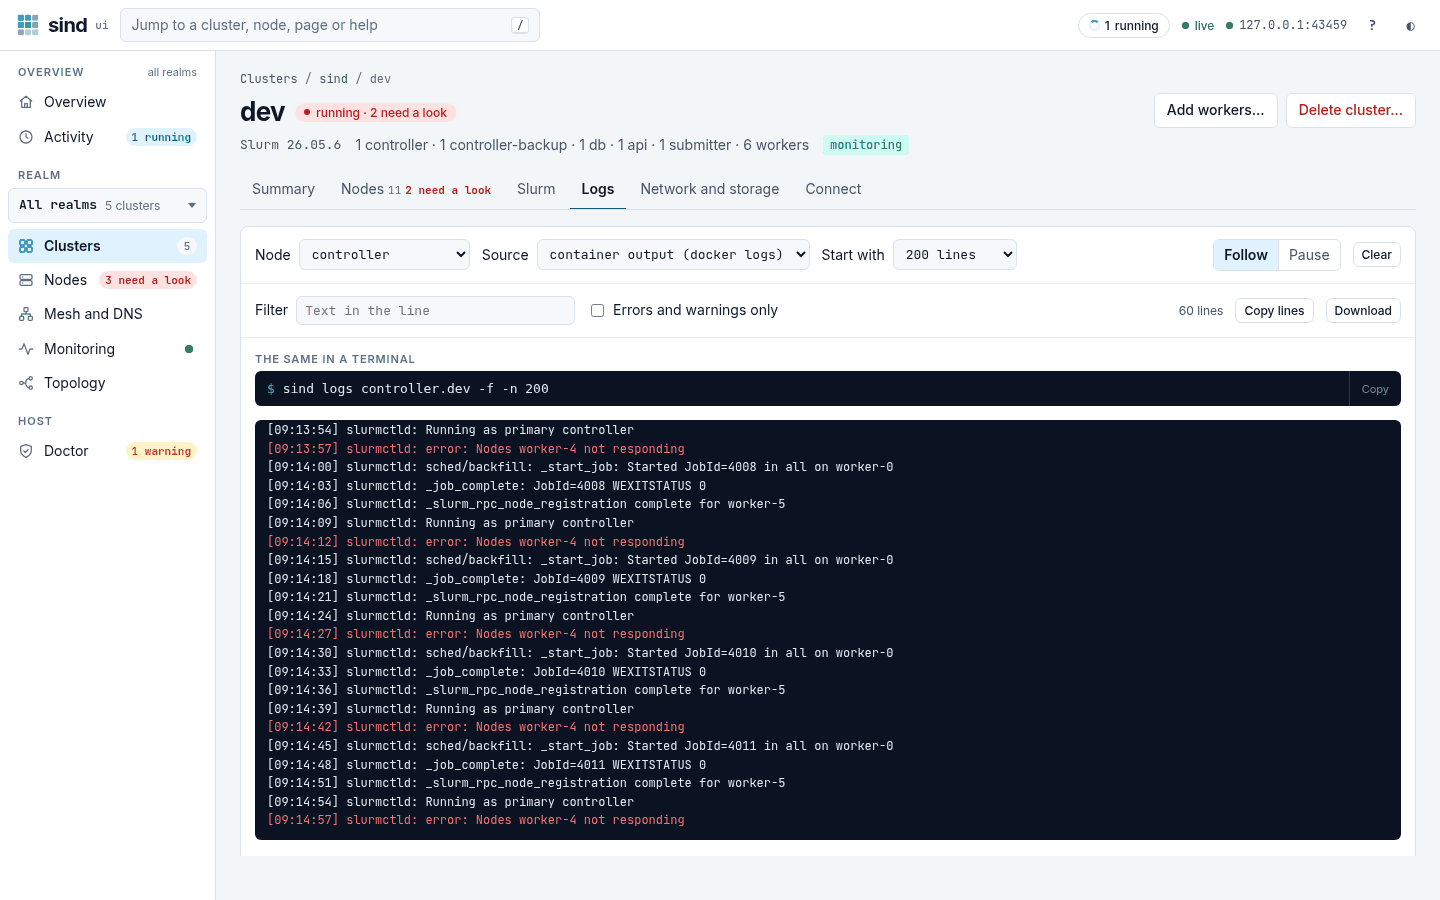
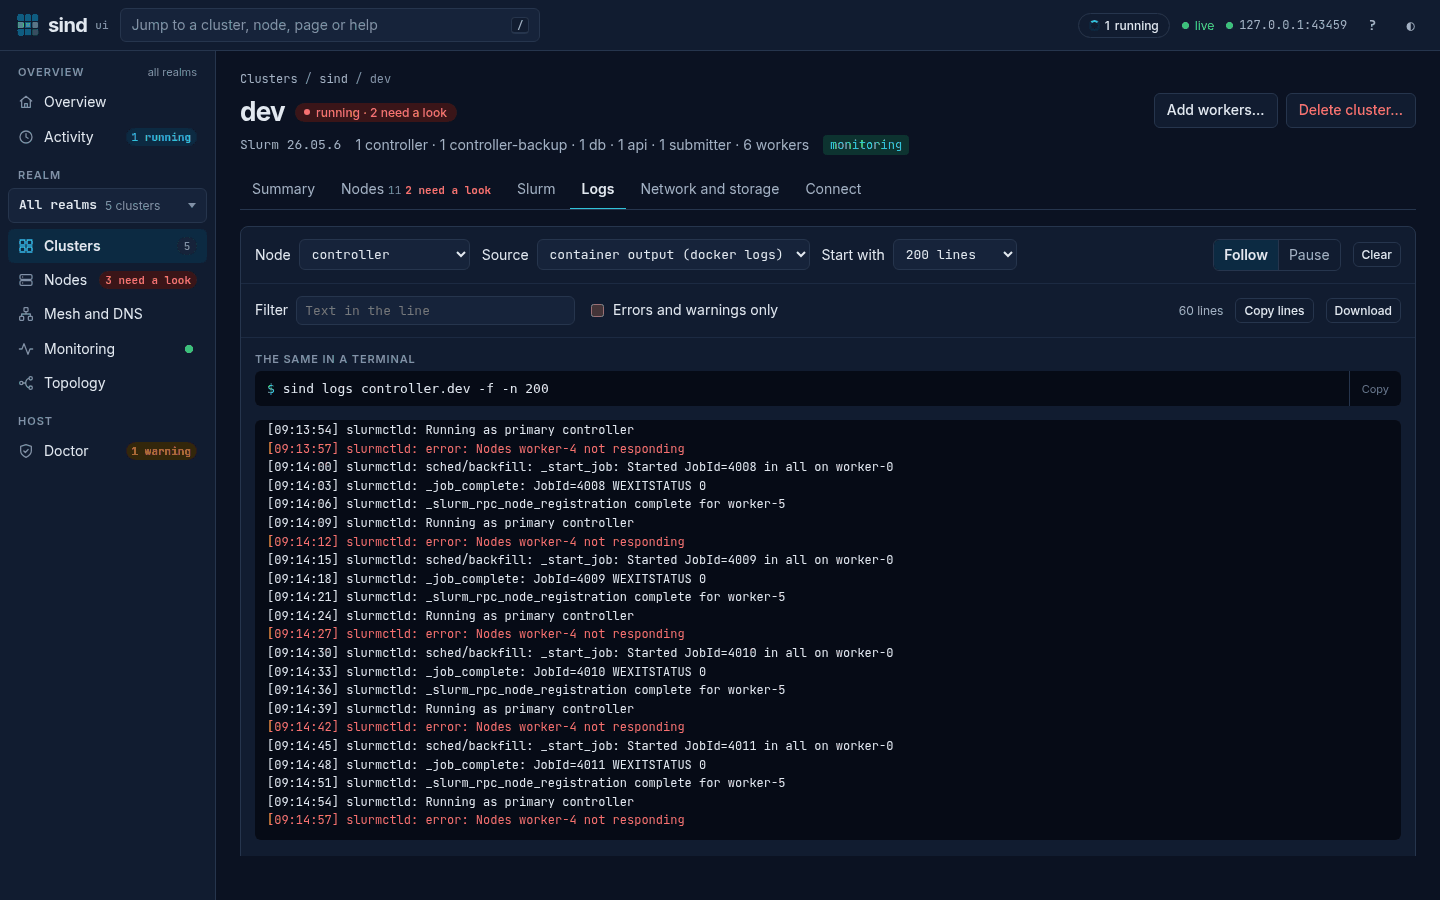
Logs shows the container log of a node, or its journal: one unit, or all units. Start with sets how many lines it shows first: 200, 1,000 or 5,000. It keeps the last 10,000. Use Pause to stop the stream and Follow to resume it.
Type in Filter to show only the lines with that text, or tick Errors and warnings only. The filter hides lines and keeps them. Copy lines and Download take the lines that show. The address keeps every choice, so a reload or a shared link shows the same log.
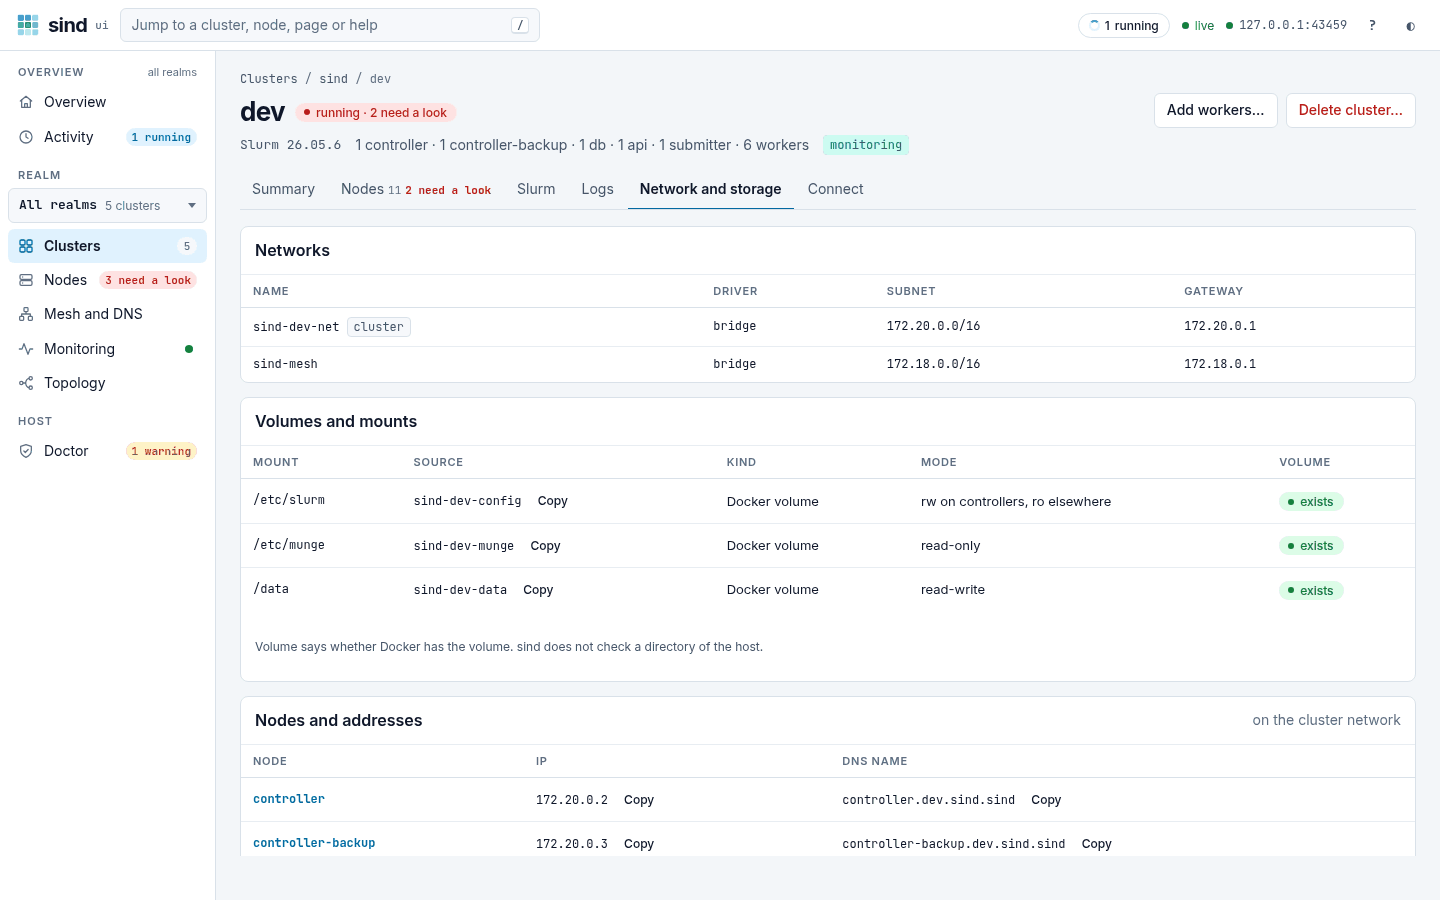
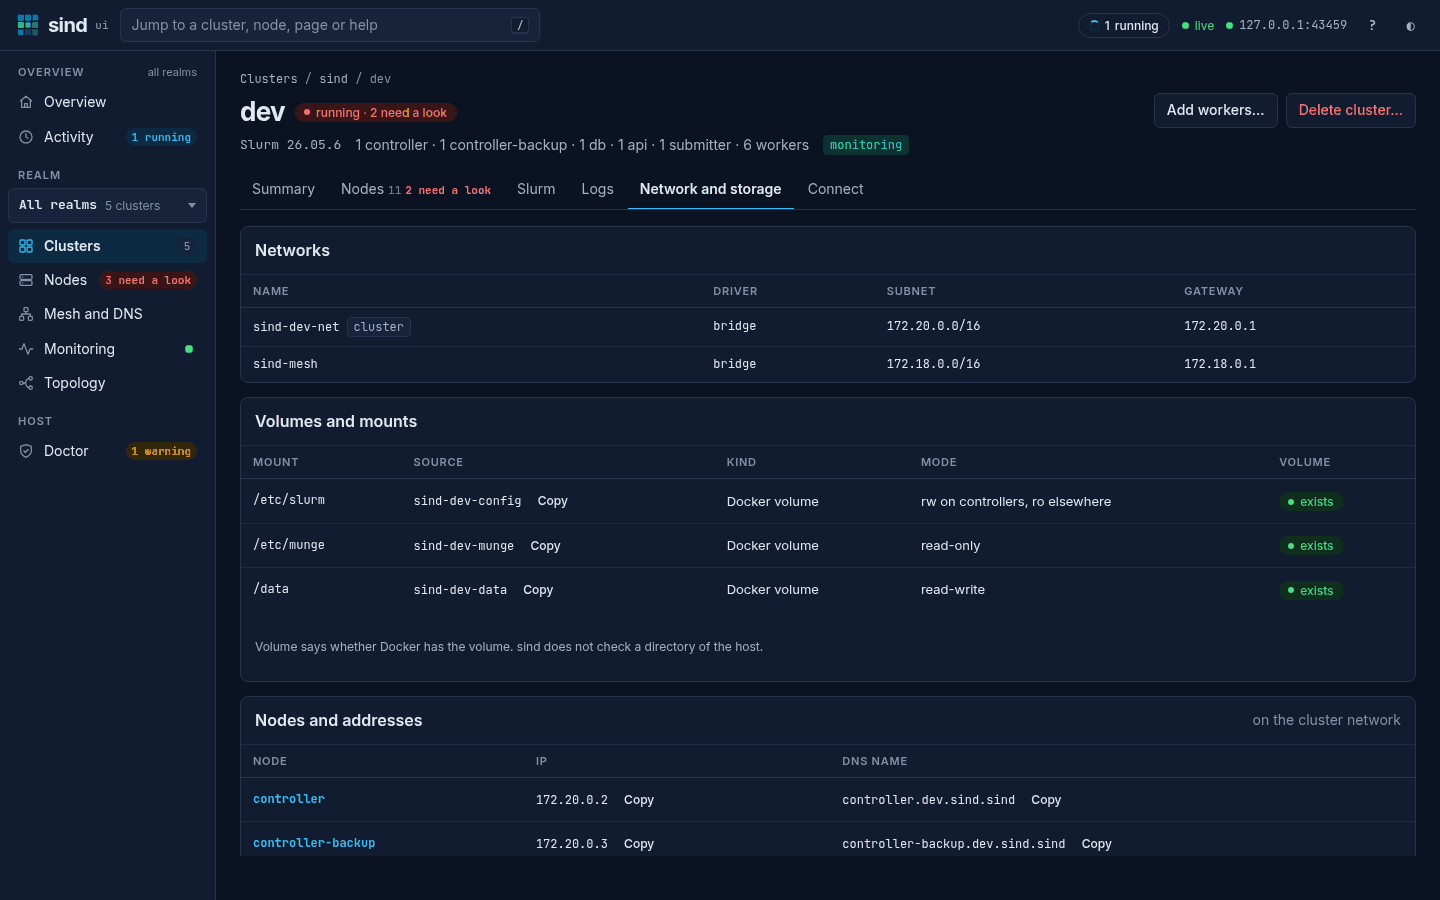
Network and storage lists the networks of the cluster, and its volumes and mounts with their kind, a Docker volume or a host directory, and their mode: the controllers write /etc/slurm and the other nodes only read it, /etc/munge and /cvmfs are read-only, and the others read-write. Volume says whether Docker has the volume; a host directory is not checked. It shows the address and DNS name of each node, the DNS zone and how nodes are named in it, the DNS server and SSH relay of the realm, and where the munge key is. Values you may paste elsewhere have Copy. The key itself is never shown.
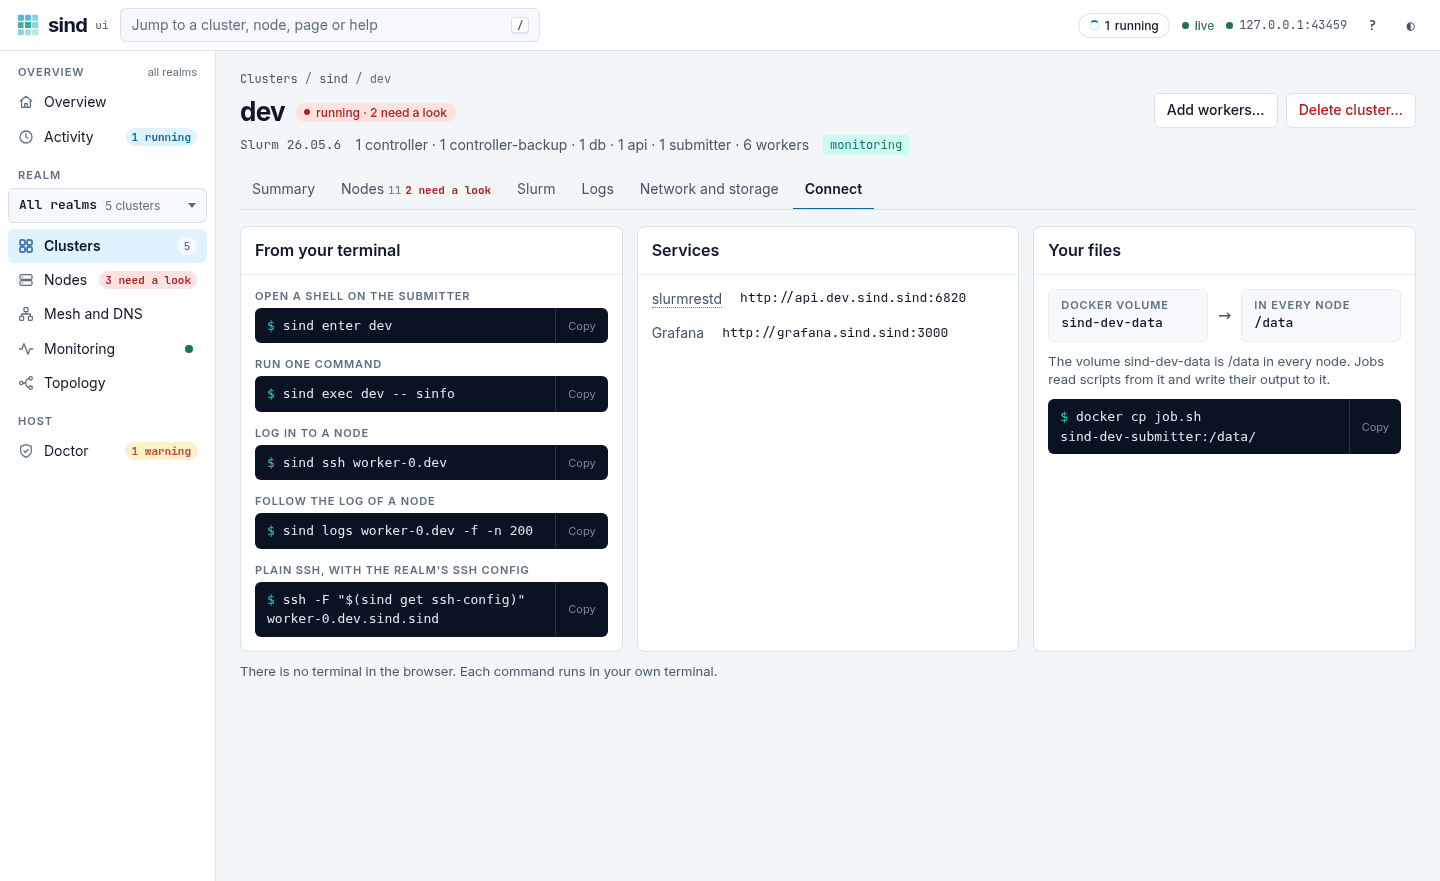
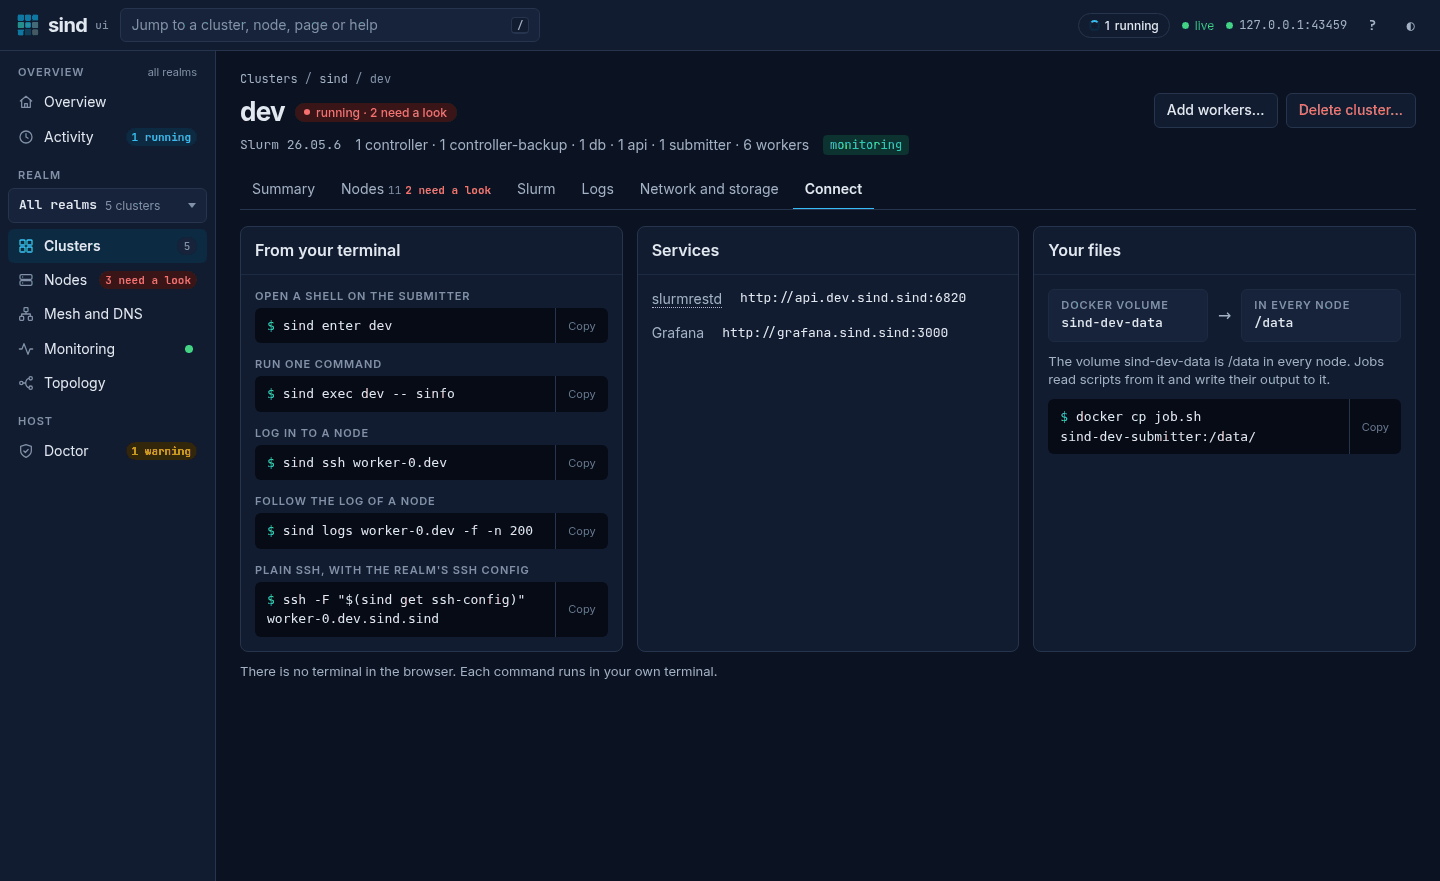
Connect shows the commands to open a shell on a node, to run a command, and to use ssh. Use Copy to copy one. Your files says where the files of your jobs are: the directory on this host or the Docker volume that every node sees at /data, with the command that copies a job script there, cp for a directory or docker cp through a node for a volume.
Node
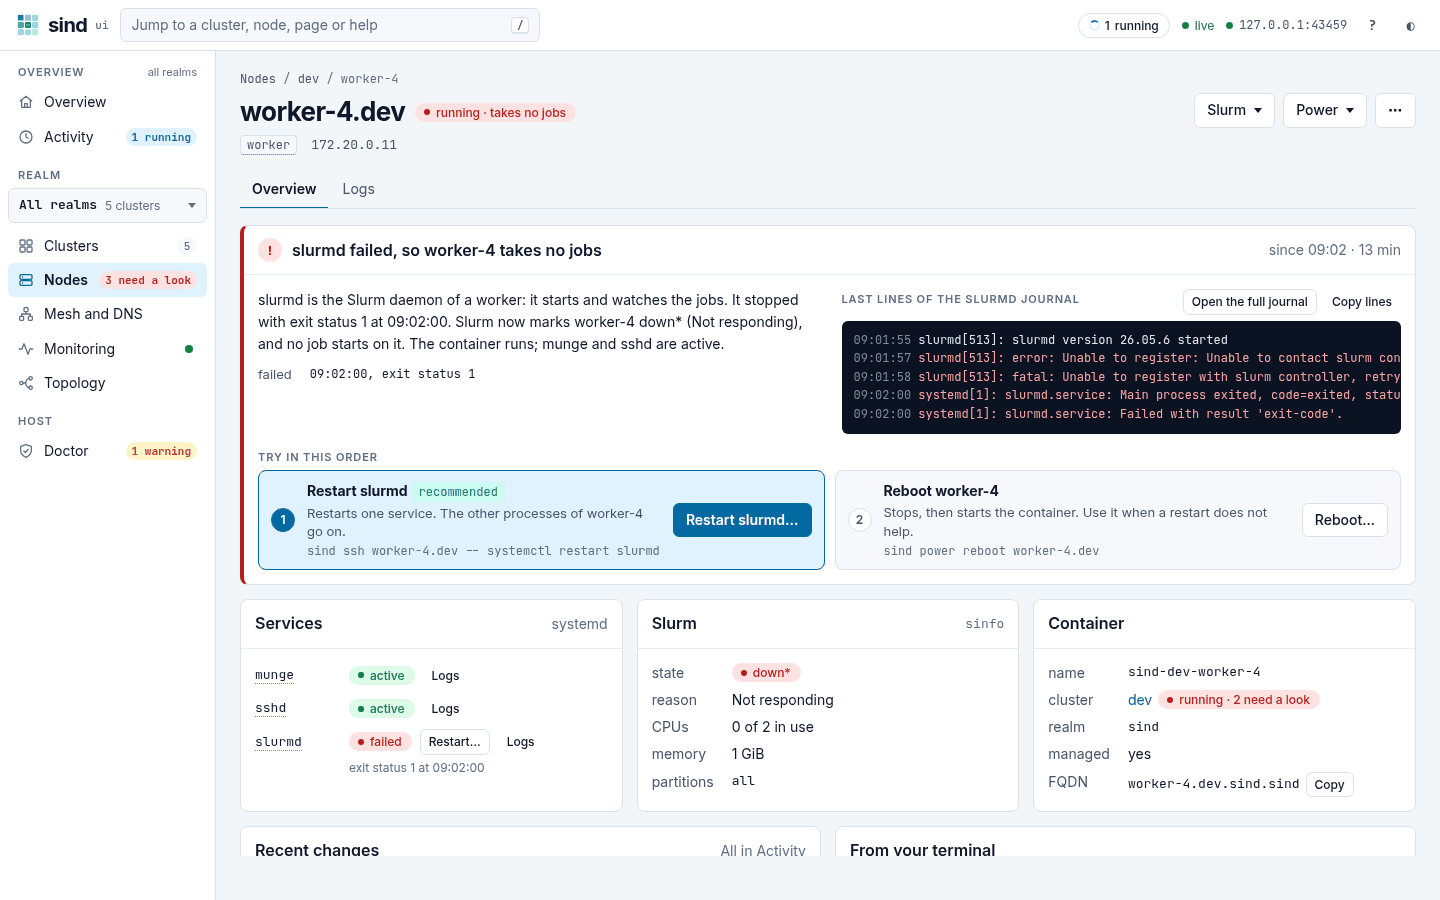
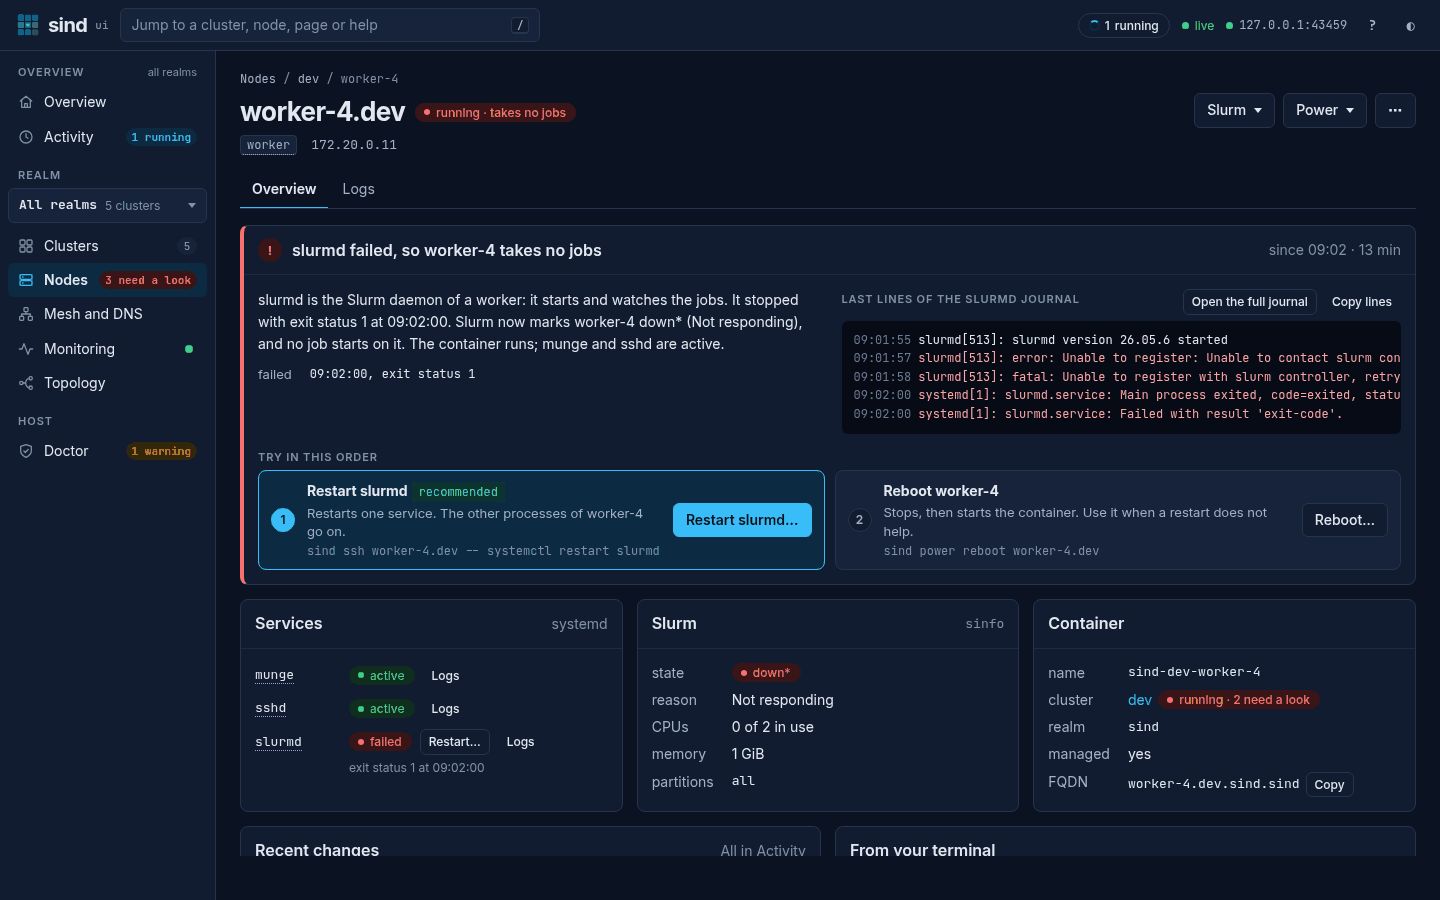
The place to find out what is wrong with one node and to fix it. When the node needs a look, a card at the top says what failed and since when, such as slurmd failed, so worker-4 takes no jobs · since 09:41, what that means for the jobs, the exit status or exit code, and the last lines of the journal of the service that failed, with Copy lines and Open the full journal. Try in this order lists the fixes, the most likely first: for a service that is down Restart slurmd…, then Reboot…; Restart munge… first when munge is down too, as the Slurm daemons need it; only Reboot… while sshd is down; Start… for a stopped node; Unfreeze… for a frozen one; Resume… for a worker that Slurm sends no jobs. Each says what it does and shows the command that a terminal runs. When a fix ends ok, the card turns green for 30 seconds, counts them down, and says what sind ui checked again. While the node’s status does not show the fix yet, as while a service still starts, the card is blue and says what it waits for; if the problem is still there when it hides, the red card comes back. When the problem comes back after the fix held, the red card says so.
The verbs that do not fix the node are in menus at the top: Slurm (Drain, Resume) for a worker, Power (Start, Reboot, Shut down, Freeze, Unfreeze, and Power-cycle and Cut power, which can lose data) and ⋯ (Delete worker). A verb that does not fit the node now is greyed out and says why, such as It does not run. The arrow keys move through a menu, and Esc closes it.
Below are the services, each with its state, its Logs and, when it is down, Restart…; what Slurm says about the node (state, reason, CPUs, memory and partitions); the container; Recent changes, what changed on the node while sind ui ran, such as a service that went down, a Slurm state, or a command that named the node; and the commands for a terminal. The Logs tab shows the log of the node: the journal of the service that failed, of its Slurm service while it runs, otherwise the container output, with the first fix above it.
Mesh and DNS
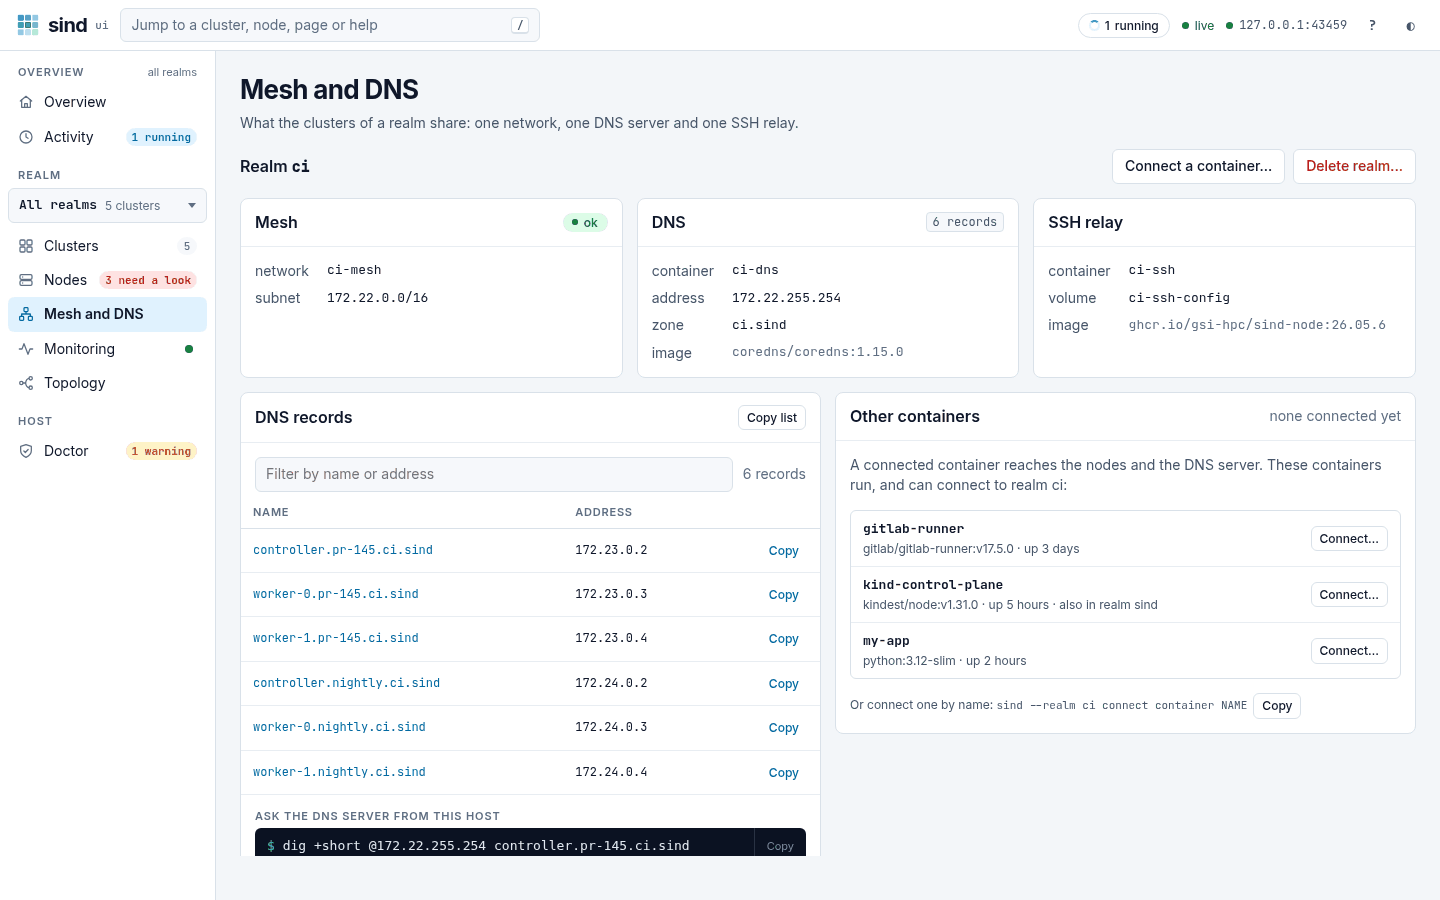
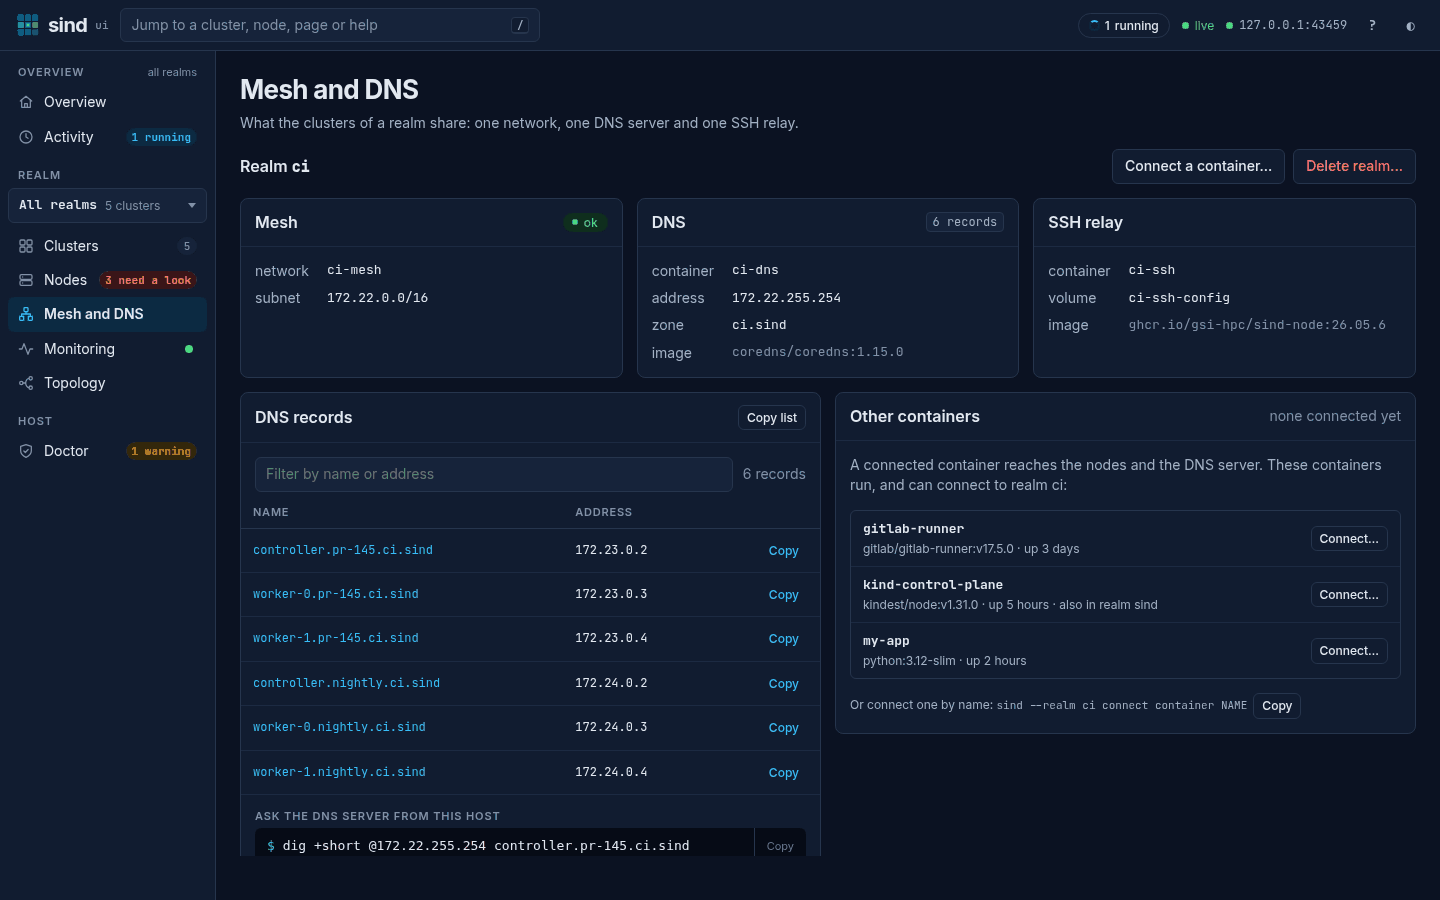
The mesh network, the DNS server and its records, and the containers that are connected to the realm. The records show the first 10; Show all N records shows the rest, and the filter above them always looks in all of them for a name or an address. Copy on a row copies its name, and Copy list copies the records that match the filter, as lines of /etc/hosts; when the browser copies nothing, the lines show in a box to copy with Ctrl+C. A name of a node opens the node. Below the records is a dig command that asks the DNS server from the host. While no container outside sind is connected, Other containers lists the ones that could be, with their image and state, each with Connect….
Monitoring
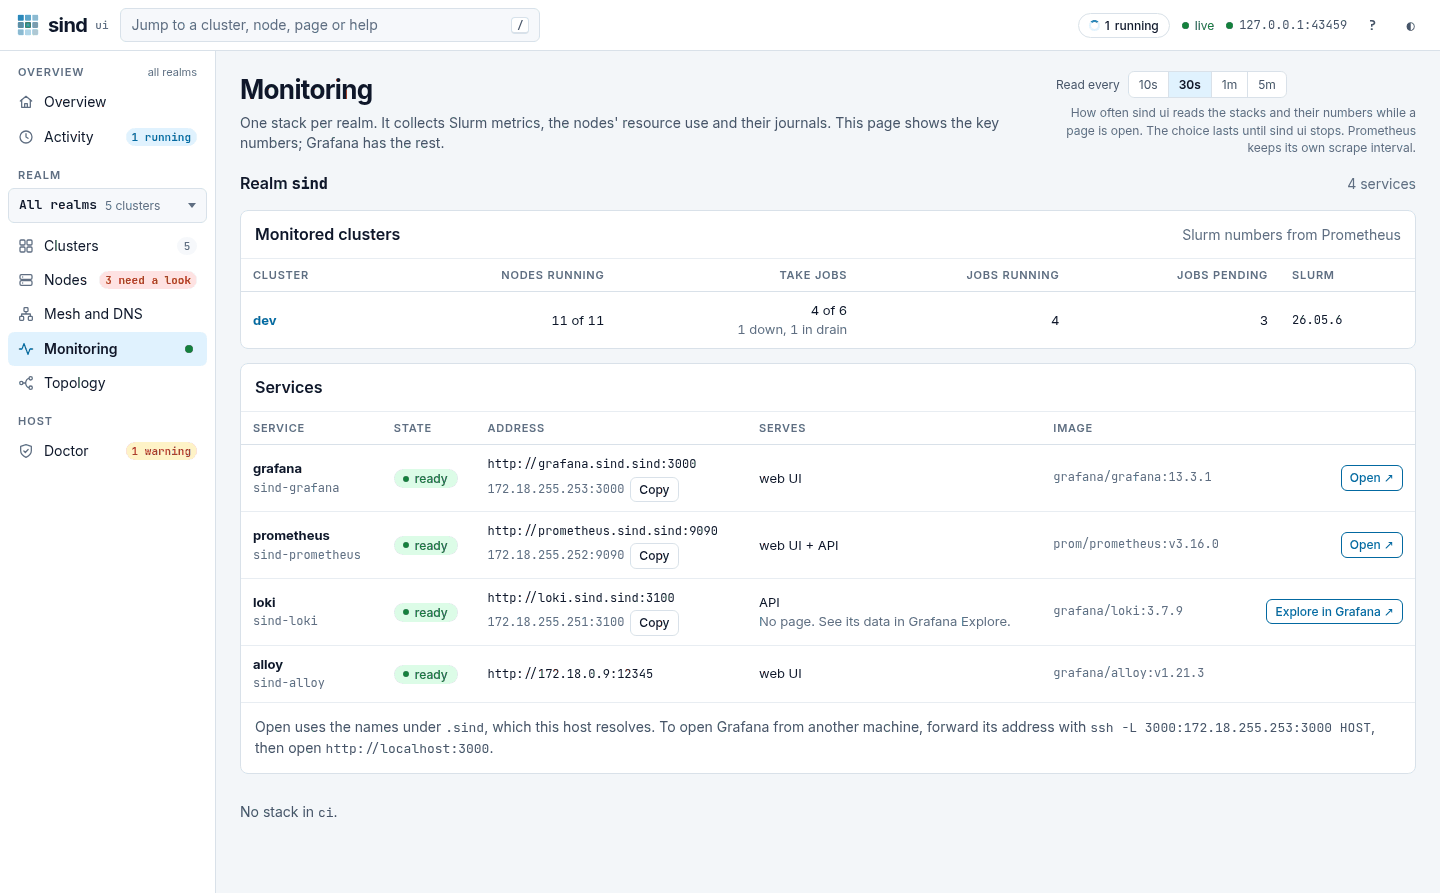
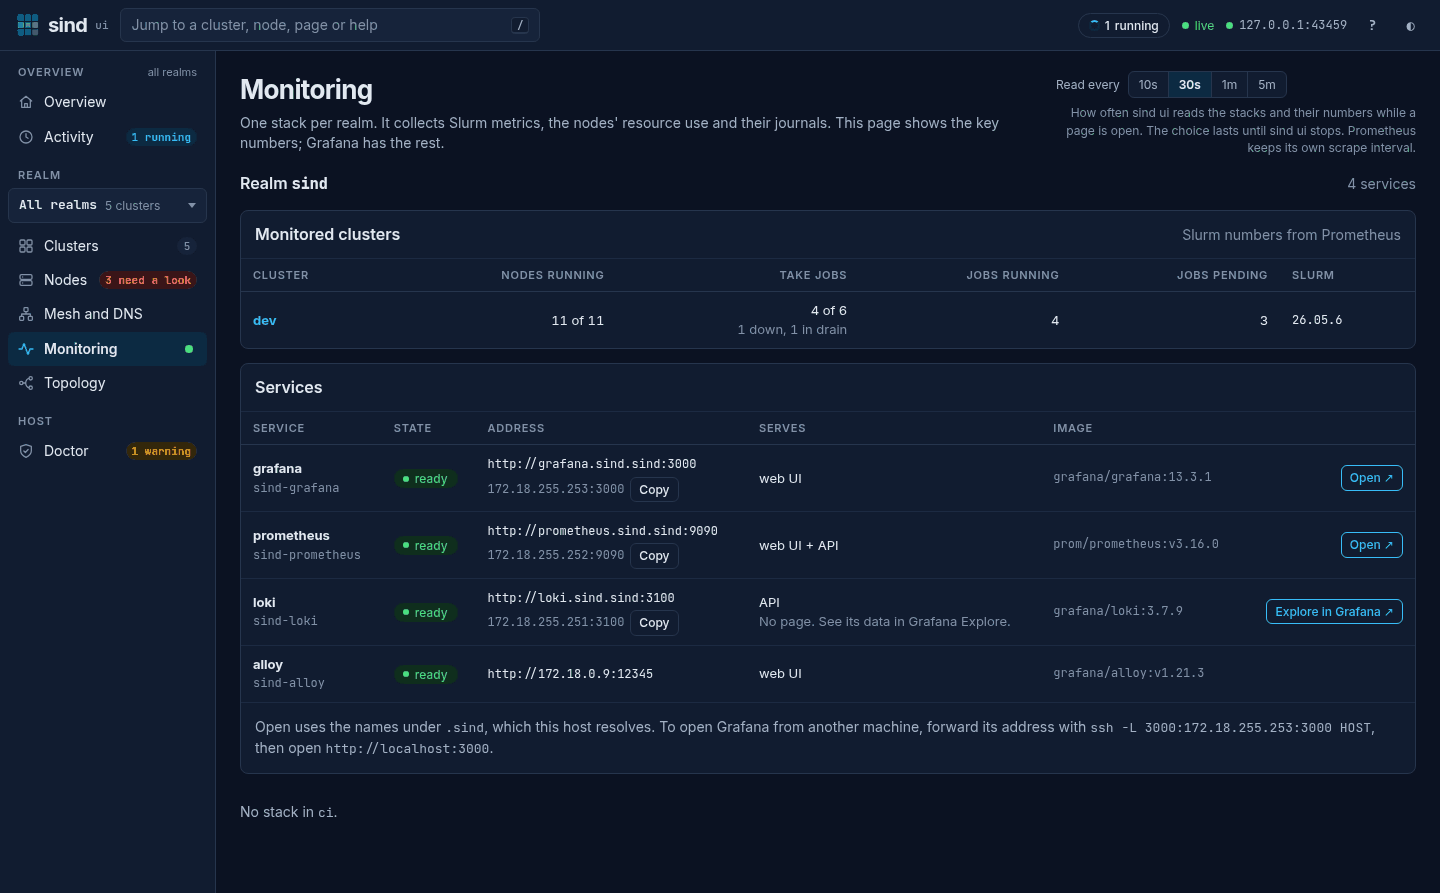
The key numbers of each monitored cluster, and the state and addresses of Grafana, Prometheus, Loki and Alloy, if the realm runs them. For each cluster, the page shows its node containers that run, and from Prometheus the Slurm nodes that take jobs (Take jobs: neither down nor in drain, as Ready for jobs counts them), with how many are down and how many are in drain (drained or draining: Slurm sends them no new jobs), and the running and pending jobs. Prometheus has these numbers once it has read slurmctld, a short time after the create. Grafana has the rest.
The Serves column says whether a service has a web UI, an API, or both. Loki serves an API only, so a browser shows no page at its address; its row has Explore in Grafana in place of Open, as Loki’s logs are read there. Open uses the names under .sind, which resolve only on the Docker host, with host DNS. Each service also shows its address with the port, with Copy. When Doctor says that the host does not resolve the names, the page says that Open fails and to use the address. From another machine, forward the address with ssh -L, as the page shows for Grafana.
The buttons Read every 10s, 30s, 1m and 5m set how often sind ui reads the stacks and their numbers while a page is open. A press saves the interval, and the page says Saved. The change lasts until sind ui stops. It does not change how often Prometheus scrapes.
Topology
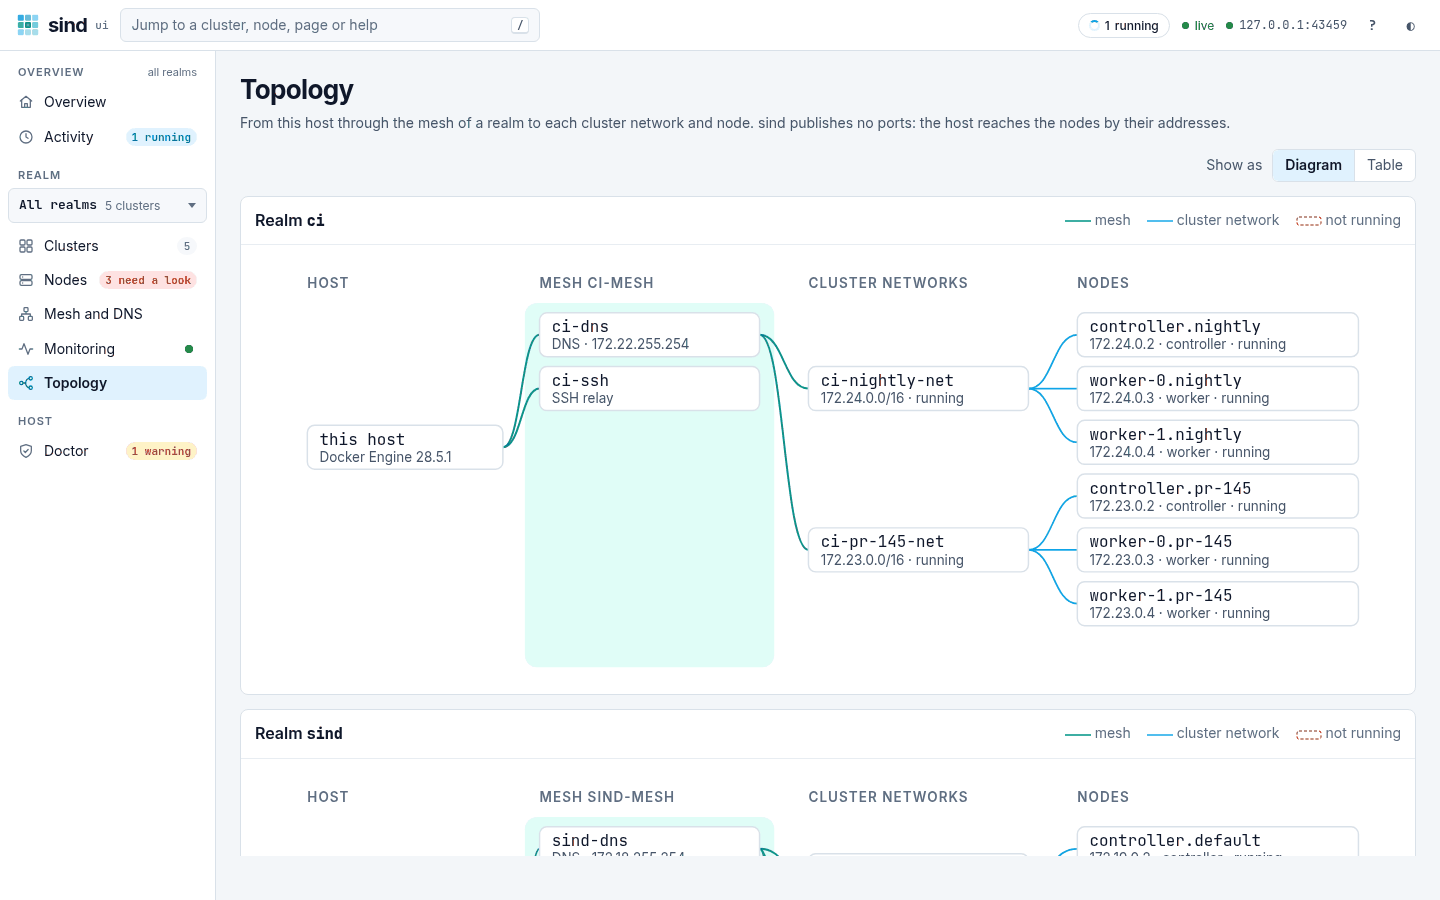
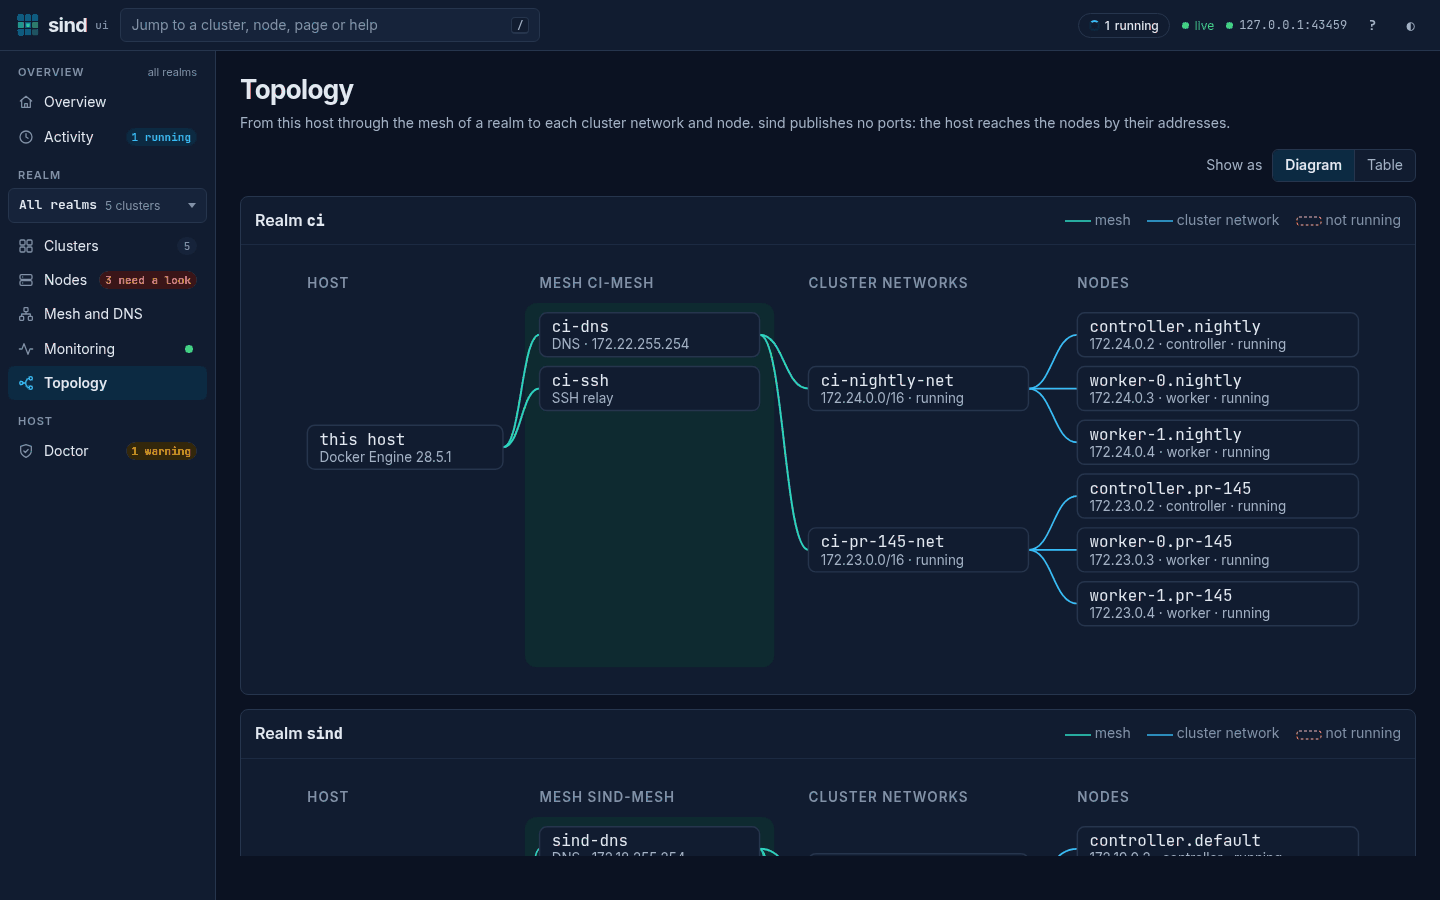
A diagram from the host, through the mesh services, to the cluster networks and the nodes. Each node shows its address, its role and its state, and each box opens its page. Show as Table lists the same things with the same links, as rows: the host and the containers on the mesh, then each cluster network with its nodes. On a narrow screen the diagram scrolls sideways, and a line above it says so; the Tab key then stops on it, and the arrow keys scroll it. On a phone the table shows each row as a card.
Doctor
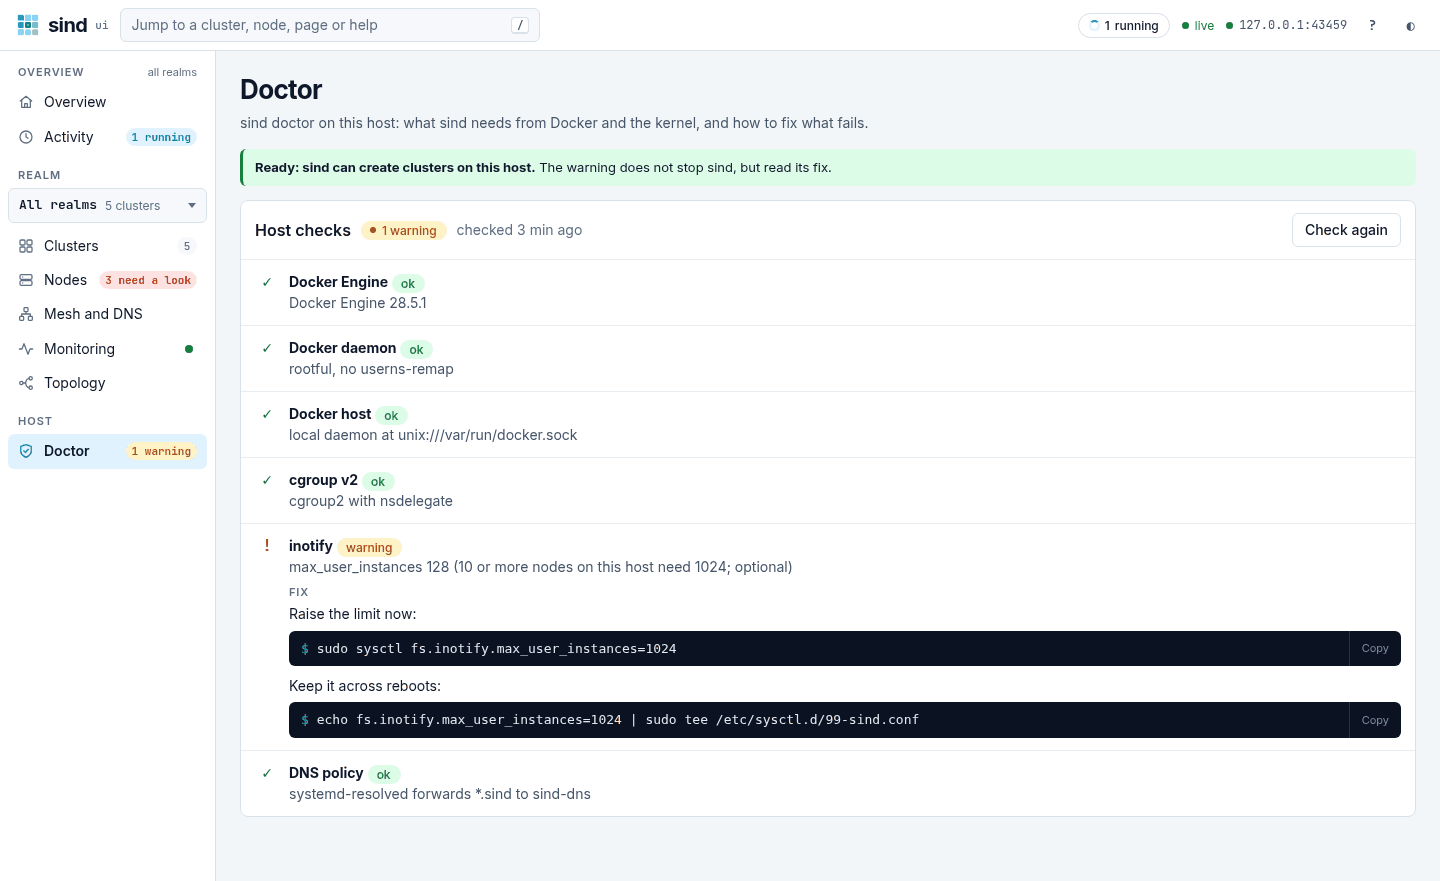
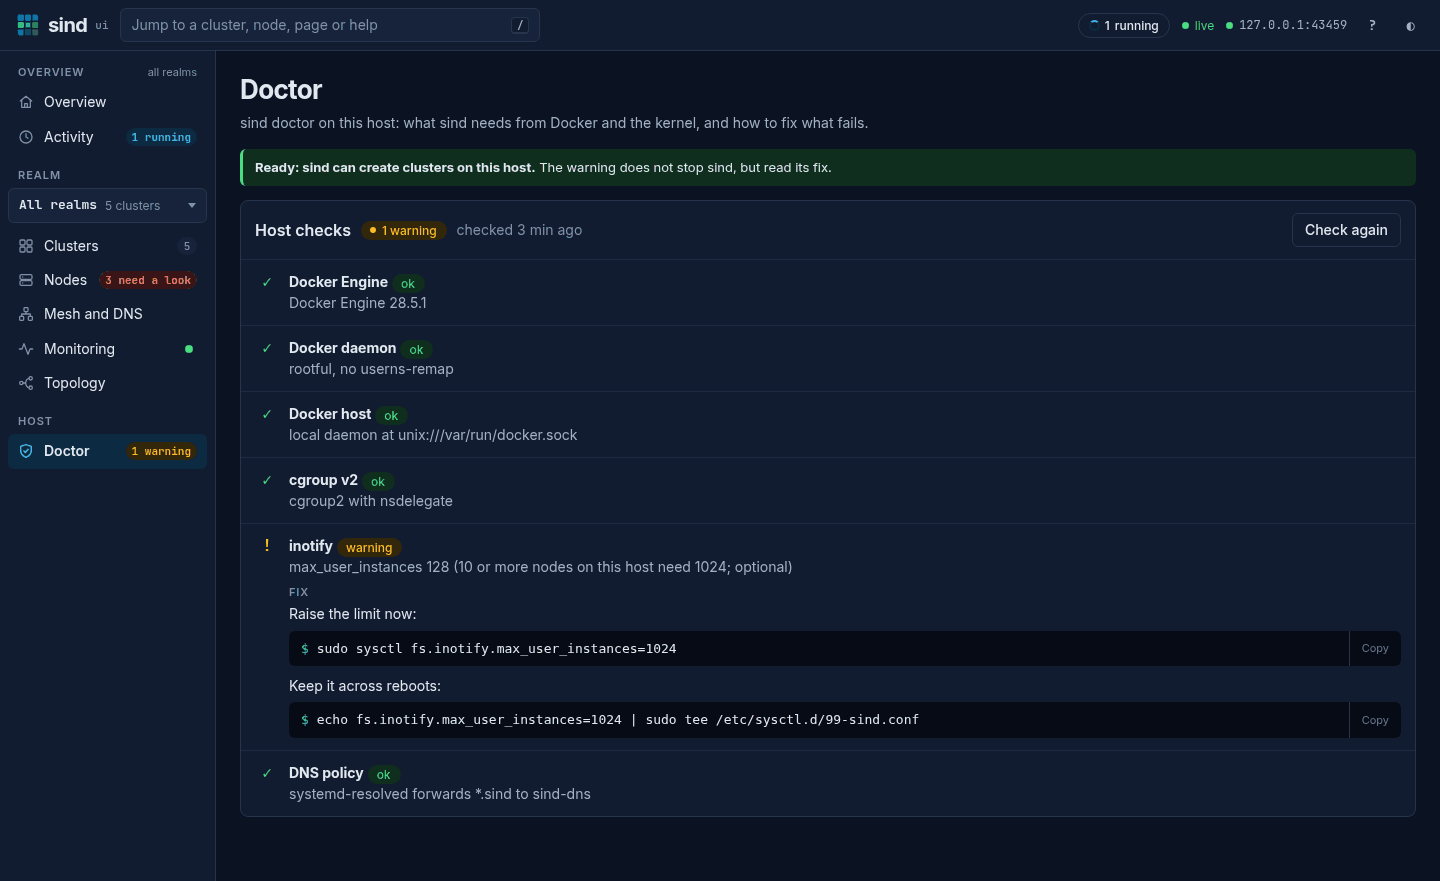
The host checks of sind doctor, each as ok, warning or failed, with the fix for each. The line at the top says whether sind can create clusters on this host: a failed check stops create and power on, a warning does not. A fix shows each command in its own block, after the words that say what it does, and Copy copies only the command. The fix for inotify has a second command that keeps the limit across reboots.
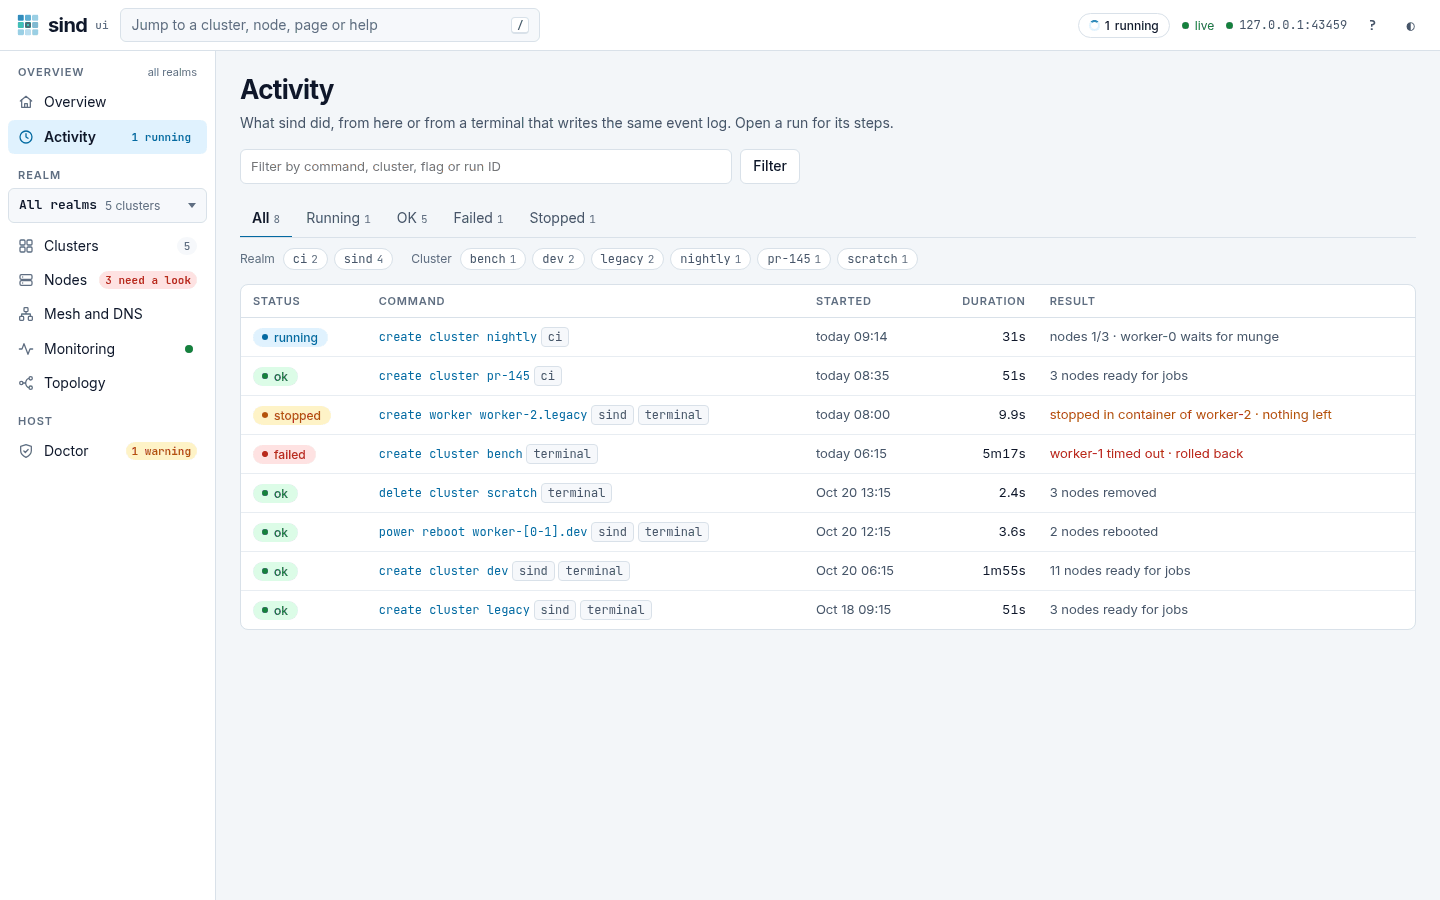
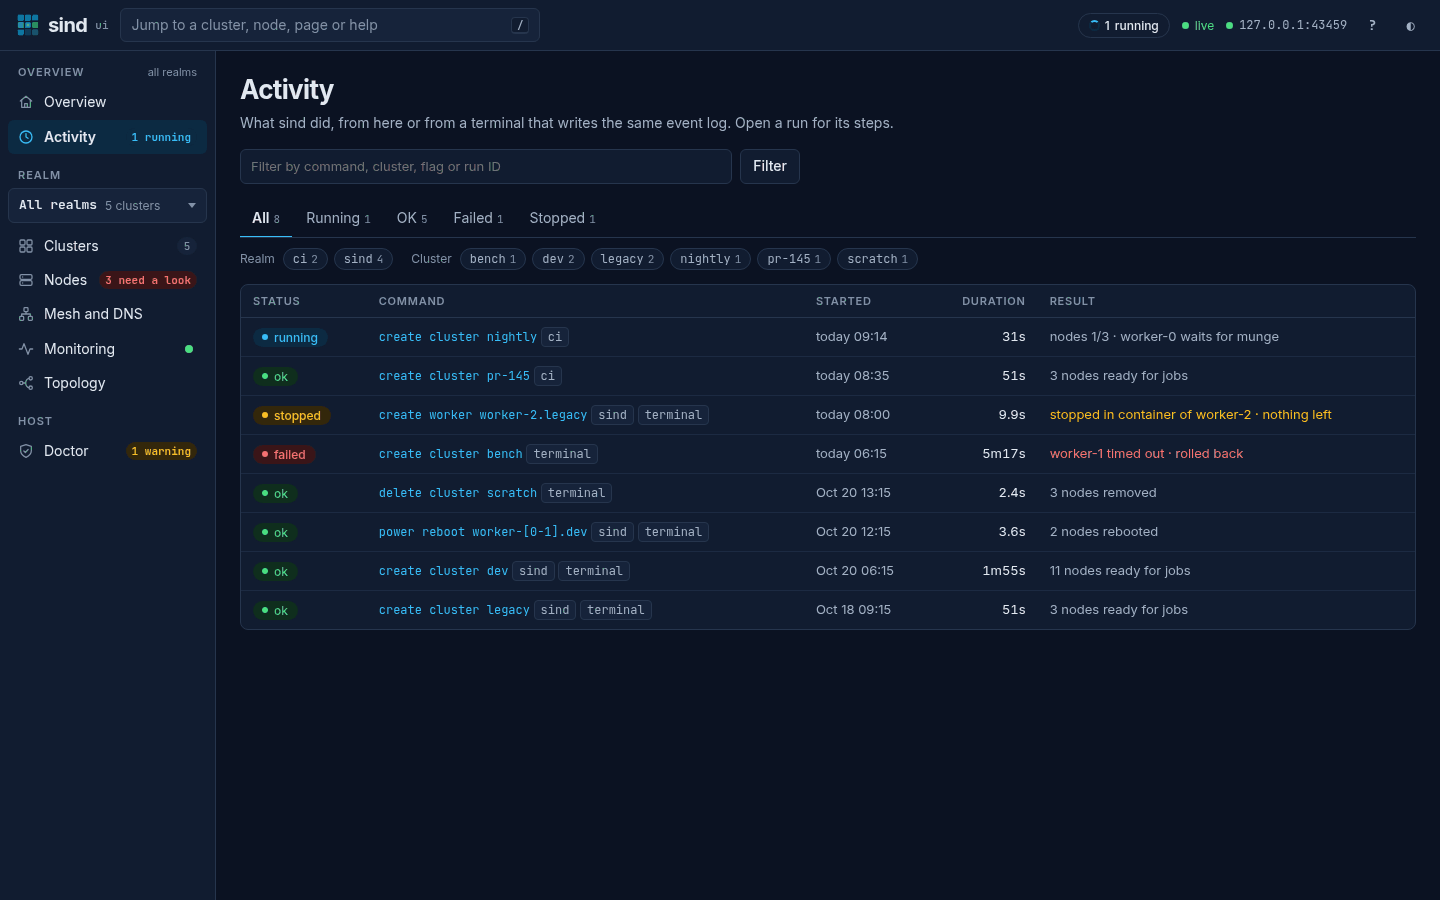
Activity
The runs of sind commands that change something, from this UI or from a terminal. A run opens its run page (see Runs and Progress).
Help
Every how-to of the help pane, with links to all words and to the keys. The rail has no entry for it: open it from All how-tos in the help pane, or at the address /help. An entry of the help pane has an address of its own, such as /help?topic=word/realm, and the search of the page, such as /help?q=sbatch, works without script (see Find things and get help).